*Corresponding Author:
Igor Z Zubrzycki,
Faculty of Health Sciences and Physical Culture of Kazimierz Pułaski University of Technology and Humanities in Radom, ul. Chrobrego 27, 26-600 Radom, Poland
E-mail: igorzubrzycki@gmail.com
Abstract
Obesity, the largest contributor to global mortality and morbidity, increases the incidence of cardiovascular disease, type 2 diabetes mellitus, and stroke. It is also associated with social disengagement, reduction of labor productivity, and psychosocial burden. In the past decade, two collaborative reports on risk factors for non- communicatory diseases have revealed the enormity of worldwide obesity. This study was an attempt to reanalyze global changes in body mass index [BMI (kg/m2)] and prevalence of obesity (%) using the only data and region stratification scheme provided by WHO. This report also analyzed the rate of changes in age-standardized mean serum total cholesterol level (≥ 0.5 mmol/L) and age standardized mean systolic blood pressure (mmHg). The results showed that the rate of change in BMI for males is generally lower than for females. The lack of information on menopausal status in the studied women population indicated that observed BMI increase in women population might have its etiology in biological aging and may be independent of poor dietary habits. There is a decrease in serum total cholesterol levels stratified by sex in the Americas, the EU, and Australia. An increase in systolic blood pressure defined nearly every country in Southeast Asia. North Korea is defined by positive changes in all parameters under consideration (sic!). The lack of apparent correlation between BMI, serum cholesterol, and systolic blood pressure occurs only in countries with policies allowing broad access to drugs for cholesterol and blood pressure increases.
Keywords
Epidemiology; Obesity; Systolic blood pressure; Total serum cholesterol
Introduction
The scientific literature indicates that obesity is the primary driver of global mortality and morbidity. For example, obesity increases the incidence of cardiovascular disease [1], type 2 diabetes mellitus [2], and stroke [3]. However, the validity of the association between obesity and stroke has recently been questioned [4].
Obesity is associated with social withdrawal [5], reduced labor productivity [6], and psychosocial burden [7]. Correlations between obesity and unemployment [8] rendered worldwide social and economic problems [9]. Some argue that global obesity is at a pandemic level [10]. As a result, the stress induced by obesity on economies and health services led to the construction and implementation of global guidelines to prevent obesity [11]. Despite preventive measures, the recent NCD Risk Factor Collaboration (NCD-RisC) study reported that obesity is still a global economic and health-related problem [12,13]. NCD-RisC: A worldwide health scientist’s web providing data on risk factors for non-communicable diseases (NCDs).
Although the NCD-RisC report [12] showed Body Mass Index [BMI(kg/m2)=body mass (kg)/height2(m2)] to be a global “culprit” of non-communicative diseases, its conclusions omitted the U.S.A; the country with not only one of the globally highest rate of BMI increase but also one of the worst health care systems among developed nations [14]. Furthermore, NCDs-RisC reports [12,13] did not follow World Health Organization (WHO) regionalization scheme. Instead, a vague stratification scheme using statements such as “English-speaking countries” was introduced. Moreover, the means of a graphical representation of the data, in particular Figure 1 of the CRS-RISC report [12], lead, in our view, to an erroneous understanding of the current world situation.
Taking into account the outline shortcomings, we briefly reviewed the WHO data [11,15] and reported worldwide changes in BMI, obesity (BMI ≥ 30), systolic blood pressure [SBP (mmHg)], and total serum cholesterol level [STChol (mg/dL) ≥ 5.0 mmol/L].
Materials and Methods
The statistical data, including age-standardized mean BMI, age-standardized STCh, age-standardized mean SBP, and obesity prevalence (%) by region, country, year, and sex, for 1975-2016 were taken directly from the WHO repository [15]. The methods of collecting and preparing the original data are described in a separate document [11]. The data were extracted from the WHO repository using the WHO Application Programming Interface (API) and custom-written software in the R programming language [16].
WHO includes 194 member states divided into the 6 following subregions: AFR=Africa; AMR=Americas; EMR=Eastern Mediterranean; EUR=Europe; SEAR=South-East Asia; WPR=Western Pacific. The following countries are incorporated in the following subregions: AFR-Algeria, Angola, Benin, Botswana, Burkina Faso, Burundi, Cameroon, Cabo Verde, Central African Republic, Chad, Comoros, Congo, Côte d’Ivoire, Democratic Republic of the Congo, Equatorial Guinea, Eritrea, Ethiopia, Gabon, Gambia, Ghana, Guinea, Guinea-Bissau, Kenya, Lesotho, Liberia, Madagascar, Malawi, Mali, Mauritania, Mauritius, Mozambique, Namibia, Niger, Nigeria, Rwanda, Sao Tome and Principe, Senegal, Seychelles, Sierra Leone, South Africa, South Sudan, Swaziland, Togo, Uganda, United Republic of Tanzania, Zambia, Zimbabwe; AMR - Antigua and Barbuda, Argentina, Bahamas, Barbados, Belize, Bolivia (Plurinational State of), Brazil, Canada, Chile, Colombia, Costa Rica, Cuba, Dominica, Dominican Republic, Ecuador, El Salvador, Grenada, Guatemala, Guyana, Haiti, Honduras, Jamaica, Mexico, Nicaragua, Panama, Paraguay, Peru, Saint Kitts and Nevis, Saint Lucia, Saint Vincent and the Grenadines, Suriname, Trinidad and Tobago, United States of America, Uruguay, Venezuela (Bolivarian Republic of); EMR - Afghanistan, Bahrain, Djibouti, Egypt, Iran (Islamic Republic of), Iraq, Jordan, Kuwait, Lebanon, Libya, Morocco, Oman, Pakistan, Qatar, Saudi Arabia, Somalia, Sudan, Syrian Arab Republic, Tunisia, United Arab Emirates, Yemen; EUR - Albania, Andorra, Armenia, Austria, Azerbaijan, Belarus, Belgium, Bosnia and Herzegovina, Bulgaria, Croatia, Cyprus, Czechia, Denmark, Estonia, Finland, France, Georgia, Germany, Greece, Hungary, Iceland, Ireland, Israel, Italy, Kazakhstan, Kyrgyzstan, Latvia, Lithuania, Luxembourg, Malta, Monaco, Montenegro, Netherlands, Norway, Poland, Portugal, Republic of Moldova, Romania, Russian Federation, San Marino, Serbia, Slovakia, Slovenia, Spain, Sweden, Switzerland, Tajikistan, North Macedonia, Turkey, Turkmenistan, Ukraine, United Kingdom, Uzbekistan.
The analysis encompassed changes in the age-standardized mean BMI, the age-standardized mean STChol, and the age-standardized mean value SBP levels for men and women aged 18 and older. Because changes in BMI levels are gender-based [12], sex stratification was used for all analyses. The rate of variation of the studied parameters was assessed using a linear regression model, a routine of “statistics v3.6.2” of the R -core project.
Results
Figure 1A, B shows the annual rate of change in age-standardized BMI from 1975 to 2016, stratified by country and gender. Figures 2A, B and Figures 3A, B illustrate the rate of change in mean SBP and STChol levels. Table 1 is a numeric compilation of the data shown in Figures 1-3. The annual rate of BMI, STChol, and SBP stratified by region, country and gender is presented in the Annex.

Table 1: The rate of yearly changes of studied parameters, i.e., BMI, STChol (≥ 5 mmol/L), and SBP stratified by gender and WHO region.
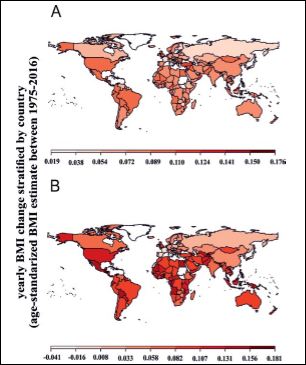
Figure 1: The rate of changes in age-standardized mean BMI in 1975 and 2014 by country A) men B) women.
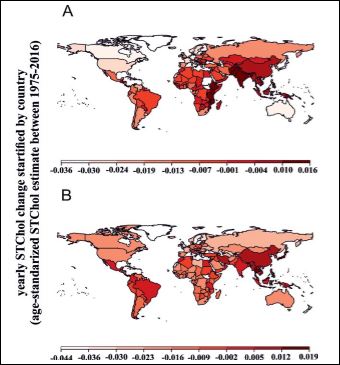
Figure 2: The rate of changes in age-standardized mean STChol levels in 1975 and 2014 by country A) men B) women.
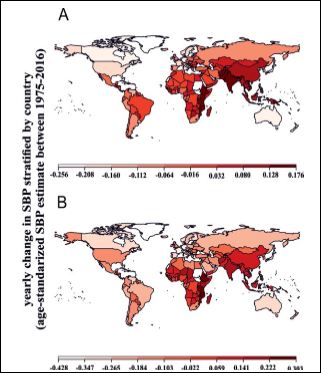
Figure 3: The rate of changes in age- standardized mean SBP levels in 1975 and 2014 by country A) men B) women.
Analysis of Table 1 revealed that the overall rate of changer in BMI in males was relatively 10.4% lower than in females. This phenomenon characterized the AFR, AMR, SEAR, and WPR regions.
The overall analysis of the rate of increase in BMI revealed the highest values for both genders in North and South America, Africa, and Australia. The minuscule increase and, in some cases, the near- constant level of BMI was observed for the EU Member States and the Russian Federation.
Analysis of STChol level changes, stratified by region and gender, unfolded decline in both Americas, the EU, and Australia for men and women (Figures 2A, 2B), respectively. There was a notable rise in STChol level in South Asia and East Africa. Furthermore, China, one of the world’s largest nations, is defined by an apparent rise in the level of STChol in both genders.
Analysis of the worldwide rate of change in SBP (Figure 3A, 3B) unfolded U.S.A., Canada, and Australia as countries and continents defined by a decrease in SBP for both genders. The South Asia region experienced a noteworthy annual increase in SBP. Furthermore, highly populated countries such as China and India are defined by a substantial increase in SBP in both genders.
An increase in obesity prevalence (BMI >= 30 kg/m2) stratified by WHO region and gender is presented in Figures 4A,4B. Analysis of Figures 4A and B identified Southeast Asia (SEAR) and Africa (AFR) as the regions with the substantial and exponential growth in the prevalence of obesity among men and women. Also, for both genders, the relative prevalence in obesity (%) in AFR was generally lower than in AMR, EUR, and WPR. The smallest increase in obesity prevalence was observed in SEAR for both genders. In women, the prevalence of obesity in AFR is similar to that of EMR, whereas the greatest obesity prevalence defined EUR and AMR.
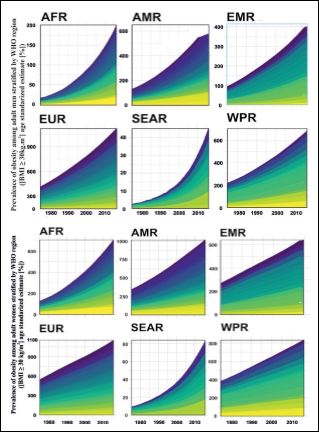
Figure 4: Trends in age-standardized prevalence of obesity (BMI ≥ 30 kg/m2) cat- egorized by WHO region: AFR=Africa; AMR=Americas; EMR=Eastern Mediter- ranean; EUR=Europe; SEAR=South-East Asia; WPR=Western Pacific; A) men, B) women; color codes withing the graphs correspond to specific countries not listed for the clarity of the figure.
Discussion and Conclusions
This study reviewed annual obesity trends already reported in NCD risk factor reports [12,13]. The latter showed a substantial increase in the incidence of obesity in the South Asia region. As a result, it tripled for men (3.2 to 10.8%) and doubled (6.4 to 14.9%) for women between 1975 and 2014. This study confirmed the previous observation. However, in this study, the SEAR region was defined by a substantial exponential increase in obesity prevalence (BMI ≥ 30 km/ m2) for men and women.
The NCD Risk Report stated that “men and women in high- income English-speaking countries in 2014 had substantially higher BMIs than those in continental Europe, whereas in 1975 the rate of BMI changes had been similar or lower, especially for women”. In our opinion, the statement is very vague and unclear. The authors have not defined ‘English-speaking nations.’ Assuming that English is one of the official languages of a country, many countries in Africa and, in principle, the whole EU must be included in this category. Thus, in our opinion, Figure 1 of the NCD Report [12] may create confusion among readers.
This study also found that most EU countries are defined by almost constant BMI levels (Figures 1A, B, Appendix 1). There is also a decline in serum levels of STChol levels and SBP (Figures 2A, B and Figures 3A, B, Appendix 1) in the male and female populations. In our view, it is a remarkable example of a well-implemented and well- managed public health policy.
NCDs also compared “West Africa” with “Central Africa” (Ibid., Figure 1). Unfortunately, the respective graph highlighted the level rather than the slope (rates: annual changes in specific value) of obesity changes. To clarify this problem, we provide graphs (Figures 1A,1B and Figures 3A,3B, Appendix 1) showing only the slopes’ value, using color codes, for the respective rates of change in BMI, STChol, and SBP.
This study also showed that countries of the eastern Africa belt, i.e., Ethiopia, Kenya, Tanzania, and Mozambique, are defined by an apparent increase in serum STChol and SBP levels in men and women. Similar values were reported for the Southeast Asian region, particularly for India and China.
Figure 1 of the NRC report [12] did not specify North America as a separate geographical entity. Meanwhile, BMI has increased substantially in the United States. Analysis of Figures Figures 1A, B - 3A, B and Appendix 1 presented in this report unfolded that in the U.S.A. the average annual increase in BMI is virtually equal to that observed for the African continent. Moreover, despite substantial differences in per capita income between the U.S.A. and the rest of the world, the rate of BMI increase in women is higher than that observed in India or China. However, China and India are defined by an increase in STChol and SBP levels, whereas decrease in these parameters defined the U.S.A. This phenomenon is probably rendered by the easy access of the US residents to drugs reducing blood pressure and cholesterol levels [17] generating excellent revenue for the pharmaceutical industry (https://www.statista.com/statistics/275560/ domestic-and-international-revenue-of-the-us-pharmaceutical- industry/).
Analysis of the global prevalence in obesity (BMI 30 kg/m2) stratified by region, country, and gender revealed a substantial increase in obesity worldwide. For both genders, obesity has grown exponentially in AFR and SEAR regions. An amalgam of this observation with the previously reported relationship between income and obesity [18] revealed correlations between pauperization and obesity. In our view, the example of such is countries of the African continent [19], India [20], and China [21].
The main shortcoming of this and the previous study was the lack of stratification of the women population by menopausal status. It is well known that perimenopause is one of the most critical factors influencing an age-dependent increase in body weight [22-25]. Therefore, adjustment for menopausal status is essential for discussing changes in obesity in populations of aging women. The observed substantial increase in BMI in women may have its etiology in an aging society and be independent of poor dietary habits.
References
- Cercato C, Fonseca FA (2019) Cardiovascular risk and Di- abetology & Metabolic Syndrome 11: 74.
- Eckel RH, Kahn SE, Ferrannini E, Goldfine AB, Nathan DM, et al. (2011) Obesity and type 2 diabetes: What can be unified and what needs to be individualized? J Clin Endocrinol Metab 96: 1654-1663.
- Kernan WN, Inzucchi SE, Sawan C, Macko RF, Furie KL (2013) Stroke 44: 278-286.
- Oesch L, Tatlisumak T, Arnold M, Sarikaya H (2017) Obesity paradox in stroke - Myth or reality? A systematic PLoS One 12: e0171334.
- Rotenberg KJ, Bharathi C, Davies H, Finch T (2017) Obesity and the Social Withdrawal Syndrome. Eating behaviors 26: 167-170.
- Goettler A, Grosse A, Sonntag D (2017) Productivity loss due to overweight and obesity: A systematic review of indirect BMJ Open 7: e014632.
- Sarwer DB, Polonsky HM (2016) The Psychosocial Burden of Endocrinol Metab Clin North Am 45: 677-688.
- Monsivais P, Martin A, Suhrcke M, Forouhi NG, Wareham NJ (2015) Job-loss and weight gain in British adults: Evidence from two longitudinal studies. Soc Sci Med 143: 223-231.
- Tremmel M, Gerdtham U-G, Nilsson PM, Saha S (2017) Economic Burden of Obesity: A Systematic Literature Review. Int J Environ Res Public Health 14: 435.
- Blüher M (2019) Obesity: Global epidemiology and pathogenesis. Nature Reviews Endocrinology 15: 288-298.
- World Health Organization (2000) Obesity: Preventing and managing the global epidemic. Report of a WHO consultation. World Health Organ Tech Rep Ser 894: 1-253.
- NCD Risk Factor Collaboration (NCD-RisC) (2016) Trends in adult body-mass index in 200 countries from 1975 to 2014: A pooled analysis of 1698 population-based measurement studies with 19•2 million participants. Lancet 387: 1377-1396.
- NCD Risk Factor Collaboration (NCD-RisC) (2017) Collaboration Worldwide trends in body-mass index, underweight, overweight, and obesity from 1975 to 2016: A pooled analysis of 2416 population-based measurement studies in 128•9 million children, adolescents, and adults. Lancet 390: 2627-2642.
- Tikkanen R, Abrams M (2000) U.S. Health Care from a Global Perspective, 2019: Higher Spending, Worse Outcomes? Commonwealth Fund.
- http://apps.who.int/gho/athena/api/GHO.
- Team R (2020) A language and environment for statistical com- puting.Vienna, Austria.
- Ikeda N, Sapienza D, Guerrero R, Aekplakorn W, Naghavi M, et (2014) Control of hypertension with medication: A comparative analysis of national surveys in 20 countries. Bull World Health Or- gan 92: 10-9C.
- Kim TJ, von dem Knesebeck O (2018) Income and obesity: What is the direction of the relationship? A systematic review and me- ta-analysis. BMJ Open 8: e019862.
- Broch-Due V, Schroeder RA (2000) Producing nature and poverty in Uppsala: Nordiska Afrikainstitutet: 350
- Jayaraman R, Lanjouw P (1999) The evolution of poverty and in- equality in Indian The World Bank Research Observer 14: 1-30.
- Cheng Z (2010) Poverty in China’s Urban Communities: Profile and China Report 46: 143-173.
- Wiacek M, Zubrzycki IZ, Bojke O, Kim HJ (2013) Menopause and age-driven changes in blood level of fat- and water-soluble Climacteric 16: 689-699.
- Wiacek M, Jegal BS, Hagner W, Hagner-Derengowska M, Zubrzy- cki IZ (2012) Age- and menopause-related differences in physiolog- ical factors of health quality in women aged 35-60. Arch Gerontol Geriatr 54: 385-390.
- Wiacek M, Hagner W, Zubrzycki IZ (2011) Measures of menopause driven differences in levels of blood lipids, follicle-stimulating hor- mone, and luteinizing hormone in women aged 35 to 60 years: National Health and Nutrition Examination Survey III and National Health and Nutrition Examination Survey 1999-2002 study. Meno- pause 18: 60-66.
- Hagner W, Hagner-Derengowska M, Wiacek M, Zubrzycki IZ (2009) Changes in level of VO2max, blood lipids, and waist circumference in the response to moderate endurance training as a function of ovarian aging. Menopause 16: 1009-1013.
Citation: Wiacek M, Zubrzycki ZI, Tomasiuk R (2021) Worldwide Obesity Trends: An Analysis of WHO Data. J Obes Bod Weig 2: 005.
Copyright: © 2021 Wiacek M, et al. This is an open-access article distributed under the terms of the Creative Commons Attribution License, which permits unrestricted use, distribution, and reproduction in any medium, provided the original author and source are credited.