*Corresponding Author:
Fahmy RM,
Department of Optometry and Vision Science, College of Applied Medical Science, King Saud University, Riyadh, Kingdom of Saudi Arabia
E-mail: rfahmy@ksu.edu.sa
Abstract
Purpose: To investigate and compare sub foveal CHoroidal Thickness (ChT) and macular thickness in Kerato Conus patients (KC) with age-matched controls.
Methods: This was a cross-sectional, case-control study. KC cases were confirmed using Pentacam. All participants underwent full ophthalmic examinations including refraction, slit-lamp biomicroscopy, fundus examination, and Goldmann Applanation Tonometer. Central Corneal Thickness (CCT) and Corneal Curvature (CC) measured using Pentacam. The sub foveal ChT and macular thickness measurement were obtained by Optical Coherence Tomopgraphy (OCT). The results were compared to age- and sex- matched healthy controls.
Results: In the control group, there is a weak positive correlation between CC and sub foveal ChT. In KC group, no correlation observed between SE, CC, CCT with each location of sub foveal ChT and macular thickness apart from a weak negative correlation between SE and macular thickness. The sub foveal ChT was thinner at nasal 1.5 mm location than all sub foveal ChT locations in both groups. There was no significant difference in sub foveal CT in the 5 different locations and macular thickness between the two groups.
Conclusions: Our findings revealed that there was a highly significant difference regarding to SE and CC between control and KC groups (P < 0.0001). The sub foveal ChT was thinner at nasal 1.5 mm location than all sub foveal ChT locations in both groups. The choroid was thinnest nasally, thicker in the subfoveal region, and then thinner again temporally in both groups. There was no significant difference between the sub foveal ChT, and macular thickness in both groups. Thus, we conclude that KC do not affect the sub foveal CT, and macular thickness of KC patients.
Abstract
Choroid; Choroidal thickness; Keratoconus; Optical coherence tomography; Pentacam
Introduction
KC is a progressive, bilateral asymmetrical, non-inflammatory disorder, in which the central portion of the cornea becomes thinner and bulges forward in a conical shape [1]. Although it is an idiopathic disease, it can be affected by positive family history and associated with atopy, Down’s syndrome, Central Serous Chorioretinopathy (CSC) and Choroidal Neovascularization (CNM) [2].
The choroid is a highly vascularized structure, lying between the retina and sclera, extending from the ora serrate to the optic nerve then joins the ciliary body [3]. The subfoveal ChT ranges from 272 μm to 311 μm [4-6]. ChT is altered with many ocular and systemic diseases [7-10].
The distribution of refractive error in Saudi adults is 45.8%. Its distribution among Saudi population is myopia 24.4%, hyperopia 11.9% and astigmatism in 9.5% [11].
In 2008, there was a study have been reported the occurrence of CSC in patients with KC and suggest that molecular alterations in basement membrane interactions responsible for KC might be responsible for CSC also. Then they observed the occurrence of CSC in a few patients with KC. As known, the basement membrane is involved in KC and similar alterations in basement membrane– Retinal Pigment Epithelium (RPE) interactions would alter the integrity of the outer blood-retinal barrier. Both KC and CSC diseases may thus represent a dysfunction of epithelial layers and potentially their basement membranes. They have been notified of the need for further studies to elucidate the connection between these diseases [12].
The influence of KC on anterior ocular segment structures is well studied, but indefinite in the posterior segment. ChT changes in KC are still unclear. However, some articles are published in 2018 studied it.
Rosa Gutierrez-Bonet et al. evaluated CT at nine eccentricities (-3000 microns nasally to +5000 microns temporal to the fovea) in KC patients with different clinical stages and controls, the subjects are divided according to age into 4 groups: less than 25 years, 25 to 35 years, 36 to 45 years, and more than 45 years. The results showed a significant difference in CT between controls and KC eyes. However, this difference was less in older subjects (>45).
No difference was found between CT and different stages of KC. No significant correlation was detected in CT in patients with or without rigid contact lenses [13].
Serkan Akkaya investigated: Spherical Equivalent (SE), K-reading, CCT, axial length and various locations of CT in both KC patients (mild, moderate and severe KC) and control healthy subjects. He documented that SE and mean K were higher, and the CCT values were lower in the KC group compared with controls. There was no difference in axial length between the two groups. He measured CT at various locations (Subfoveal, Temporal 0.75mm, 1.5mm, and Nasal 0.75mm, 1.5mm) and found the CT was significantly higher in the KC group than the control group at subfoveal and extrafoveal locations except at 1.5 mm temporal to the fovea [2].
Ihsan Yilmaz et al. compared the anterior segment parameters including corneal volume, corneal apex and thinnest corneal pachymetry with posterior segment parameters including Central Macular Thickness (CMT) and CT in pediatric patients with KC and control health. They showed higher corneal volume and corneal apex in pediatric KC. However, CMT and CT were similar in pediatric patients with KC relative to normal subjects [14].
Methods
A total of 86 subjects (159 eyes) aged from 15 to 40 years old, were recruited from ophthalmology clinic in King Fahad hospital in Albaha. They were divided into two groups: Control group, comprising 41 subjects (81 eyes) age and sex-matched individuals in good general and ocular health and a KC group, comprising 45 subjects (78 eyes) diagnosed according to slit lamp bio microscopic findings and Pentacam. Stages of keratoconic eyes are as follows: 56 eyes (stage 1), 13 eyes (stage 2), 3 eyes (stage 3), 6 eyes (stage 4). Subjects that are not age matched or with glaucoma, ocular hypertension, prior refractive surgery, laser treatment, retinal diseases, or neurological diseases that could affect the optic disc or visual field, or any significant media opacity that obscured fundus examination were excluded from the study.
Each participant underwent a full ophthalmic examination, including refraction using a Tonoref II autorefractor/tonometer (Nidek, Gamagori, Japan), SE was calculated as the sum of the spherical plus half of the cylindrical error, CCT assessment, and CC performed using Pentacam (Oculus, U.S), slit-lamp biomicroscopy, fundus examination, Goldmann Applanation Tonometer, and OCT (Heidelberg Engineering).
OCT provides a high-resolution, cross-sectional image of the retina where we measured the sub foveal ChT manually from this scan. We determine 5 various locations (Nasal 1.5, 0.75mm, Sub foveal, Temporal 1.5, 0.75mm) by using caliper measuring CT from the outer limit of the hyper-reflective band representing the RPE to the outer boundary of the choroid (Figure 1).
Ethical consideration
The study was approved by the concerned Ethical Committee. Its protocol was explained to each participant at the time of recruitment and informed consent was obtained according to the Declaration of Helsinki.
Statistical analysis
Statistical analysis was performed using Statistical Package for the Social Sciences (SPSS) version 23.0 software (SPSS Inc., Chicago, IL, USA). We calculated frequencies andpercentages for all nominal variables, mean, standard deviation (SD), median, and range (minimum – maximum) for all measurable variables (numerical variables). We used Mann-Whitney U test to compare between control group (normal eyes) and study group (KC eyes). We considered there was a significant difference when P-value less than (P < 0.05).
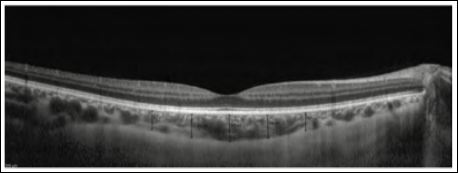
Figure 1: Choroidal thickness at different locations.
Results
Demographic characteristic
One hundred fifty nine eyes of eighty six subjects were enrolled in the study: Eighty one control eyes and seventy eight KC eyes. Thirteen eyes were excluded: One of the control eyes was excluded due to a corneal opacity, while the twelve keratoconic eyes all performed previous cross linking.
In the control group the male/female ratio was 16 (39%) and 25 (61%). While in KC group was 25 (55.6%) and 20 (44.4%). There was no significant difference in gender distribution between two groups (P =.125). The mean age of male/female was 22.625 ± 4.87 and 23.0 ± 5.416 years in control group (P =0.914) while in KC group was 29.60 ± 7.405 and 27.55 ± 7.207 years (P=0.356), (Figures 2 & 3).
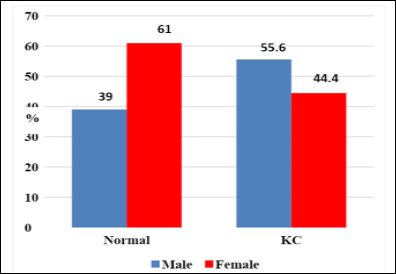
Figure 2: Gender distribution for normal and KC groups.
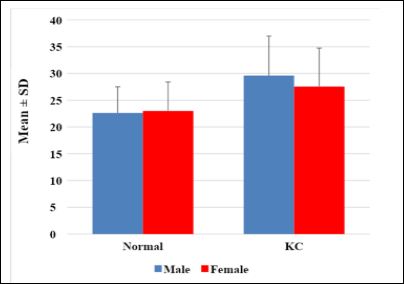
Figure 3: Age distribution for normal and KC groups.
Table 1 demonstrates a descriptive analysis of anterior ocular parameters (SE, CC, and CCT) for both groups. There is a highly significant difference regarding SE and CC between the two groups (P<0.0001). While there was no significant difference of CCT between the two groups (P=0.103)

Table 1: Descriptive analysis of anterior ocular parameters (SE, CC, and CCT) for both groups.
*By Mann-Whitney U test
Table 2 displays a descriptive analysis of posterior ocular parameters (ChT and macular thickness) for both groups. In the control group, ChT was thinnest at the nasal 1.5 mm location (293.625 μm ± 21.54 μm), followed by temporal 1.5 mm (296.838 μm ± 22.32 μm), then temporal 0.75 mm (331.0 μm ± 16.90 μm), then nasal 0.75 mm (332.513 μm ± 16.41μm), and thickest in sub foveal location (335.775μm ± 15.73 μm). Similar findings approximately was observed in KC group, the thinnest ChT was in the nasal 1.5 mm location (300.821 μm ± 33.021 μm), followed by temporal 1.5 mm (301.91 μm ± 35.487 μm), then nasal 0.75 mm (331.603 μm ± 39.818 μm), temporal 0.75 mm (336.128 μm ± 45.91 μm) and thickest (339.333 μm ± 52.67 μm) in the sub foveal location.
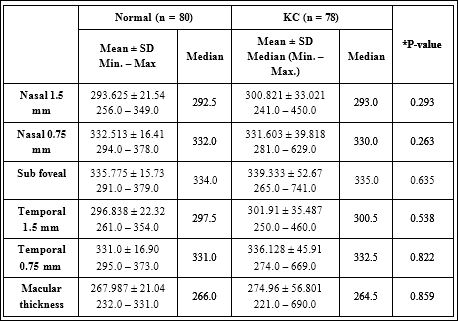
Table 2: Descriptive analysis of posterior ocular parameters (ChT and macular thickness) for both groups.
*By Mann-Whitney U test
In both groups, the sub foveal ChT was thinner at nasal 1.5 mm location than at all sub foveal Locations: the sub foveal ChT was thinnest nasally, thicker in the sub foveal region, and gets thinner again temporally. So the lowest and highest values for sub foveal ChT were observed at nasal 1.5 mm, and at the sub foveal location, respectively.
The macular thickness was (267.987 ± 21.04, 274.96 ± 56.801) in control and KC group, respectively. There was no significant difference between both groups (P=0.859). In both groups, by using Mann-Whitney U test we found there was no significant difference in sub foveal ChT in the 5 different locations and in macular thickness between the two groups (p ≥ 0.50).
In control group, we found weak positive correlation between CC and sub foveal ChT since r = 0.242, P-value = 0.031, moreover a weak negative correlation between SE and Macular Thickness since r = - 0.276, P-value = 0.013 (Table 3).
However in KC group, we found no correlation between SE, CC, CCT and each of nasal (1.5 mm, 0.75 mm) ChT, sub foveal ChT, and temporal (1.5 mm, 0.75 mm) ChT since (P-value > 0.05) (Table 4).
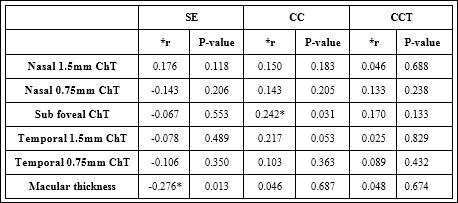
Table 3: Correlations between anterior and posterior ocular parameters (control group).
*r is Pearson’s correlation coefficient
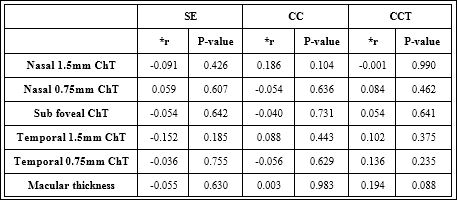
Table 4: Correlations between anterior and posterior ocular parameters (KC group).
*r is Pearson’s correlation coefficient
Correlation between Ch T and keratoconus stage: The mean of sub foveal ChT at Nasal 0.75 & 1.5mm was thicker in stage 3, and became thinner gradually in stages 4, 1 & 2. The Sub foveal ChT was thicker in stage 3 and gets thinner gradually in stages 2, 1 & 4. The temporal ChT 1.5mm was thicker in stage 3 and gets thinner gradually in stages 4, 2 & 1. The temporal ChT 0.75mm and macular ChT were thicker in stage 3 and became thinner in stages 4, 1 & 2 respectively.
Discussion
Our study carried out on 81 control eyes and 78 KC eyes revealed that there are no statistically significant differences in sub foveal ChT and macular thickness between control and KC groups by using Heidelberg engineering spectralis OCT.
We observed that myopic individuals have thinner choroids compared to hyperopic individuals. And sub foveal ChT is thinner nasally, and temporally and is thicker in the sub foveal region, these findings fit well with Serkan study [2].
In addition, Margolis and Spaide study proved that ChT decreases rapidly in the nasal direction which is an agreement with our results [15].
The mean of sub foveal ChT at different locations and macular thickness were insignificant between the control and KC groups, respectively (293.625 μm ± 21.54 μm, 300.821 μm ± 33.021 μm, P=0.293) for nasal 1.5mm, (332.513 μm ± 16.41 μm, 331.603 μm ± 39.818 μm, P=0.263) for nasal 0.75mm, (335.775 μm ± 15.73 μm, 339.333 μm ± 52.67 μm, P=0.635) for sub foveal ChT, (296.838 μm ± 22.32 μm, 301.91 μm ± 35.487 μm, P=0.538) for temporal 1.5mm, (331.0 μm ± 16.90 μm, 336.128 μm ± 45.91 μm, P=0.822) for temporal 0.75mm, and (267.987 μm ± 21.04 μm, 274.96 μm ± 56.801 μm, P=0.859) for macular thickness.
Serkan and Rosa Gutierrez-Bonet et al. 2018 showed a significant difference in ChT between controls and KC eyes. They reported that KC patients had a thicker choroid, which is inconsistent with our data [2-13].
Moreover Serkan revealed that CCT was significantly correlated with sub foveal ChT except at nasal 0.75mm location which is not confident with us (no correlation between sub foveal CT and CCT in both groups). However we didn’t find a correlation between SE and sub foveal ChT in both groups which is in agreement with Serkan [2].
Conclusion
In conclusion, studying correlation between KC and ChT can be used as a predictive marker of altered basement membrane - RPE interactions affecting the integrity of outer blood retinal barrier causing CSC and choroidal neovascular membrane which are common KC association. To the best of our knowledge, our research is the first study correlating KC and the posterior segments parameters among adult Saudi population.
Recommendations
We think it is appropriate to re-evaluate the results in this study with large sample size. Also it is advisable to assess choroidal and macular thickness in keratoconus patients routinely.
Author Disclosure Statement
The authors declare no potential conflicts of interest with respect to the authorship, and/or publication of this article.
References
- Vellara H, Patel D (2015) Biomechanical properties of the keratoconic cornea: A review. Clinical and Experimental Optometry 98: 31-38.
- Akkaya S (2018) Macular and Peripapillary Choroidal Thickness in Patients with Keratoconus. Ophthalmic Surg Lasers Imaging Retina 49: 664-673.
- Remington LA (2005) Clinical anatomy and physilogy of the visual system, third edition.
- Manjunath V, Taha M, Fujimoto J, Dukek J (2010) Choroidal Thickness in Normal Eyes Measured Using Cirrus HD Optical Coherence Tomog Am JOphthalmol 150: 325-329.
- Tan CS, Cheong KX (2014) Macular choroidal thicknesses in healthy adults-relationship with ocular and demographic factors. Invest Ophthalmol Vis Sci 55: 6452-6458.
- Ho J, Branchini L, Regatieri C, Krishnan C, Fujimoto JG, et al. (2011) Analysis of normal peripapillary choroidal thickness via spectral domain optical coherence tomography. Ophthalmology 118: 2001-2007.
- Ruiz-Medrano J, Flores-Moreno I, Peña-García P, Montero JA, García-Feijóo J, et al. (2017) Analysis of age-related choroidal layers thinning in healthy eyes using swept-source optical coherence tomogra Retina 37: 1305-1313.
- Esmaeelpour M, Povazay B, Hermann B (2010) Three-dimensional 1060-nm OCT: Choroidal thickness maps in normal subjects and improved posterior segment visualization in cataract Invest Ophthalmol Vis Sci 51: 5260-5266.
- Hirooka K, Tenkumo K, Fujiwara A (2012) Evaluation of peripapillary choroidal thickness in patients with normal-tension glaucoma. BMC Ophthalmol 12: 29.
- Moschos MM, Chatziralli IP, Koutsandrea C (2013) Assessment of the macula in keratoconus: An optical coherence tomography and multifo-cal electroretinography study. Ophthalmologica 229: 203-207.
- Parrey MUR, Elmorsy E (2019) Prevalence and pattern of refractive errors among Saudi adults. Pakistan J. Med. Sci 35: 394-398.
- Eandi CM, Del Priore LV, Bertelli E, Ober MD (2008) Central serous chorioretinopathy in patients with keratoconus. Retina 28: 94-96.
- Gutierrez-Bonet R, Ruiz-Medrano J, Peña-Garcia P, Catanese M, Sadeghi Y, et (2018) Macular Choroidal Thickening in Keratoconus Patients: Swept-Source Optical Coherence Tomography Study. Transational Vis Sci Technol 7: 15.
- Yilmaz I, Yilmaz BS, Guleryuz NB, Perente I, Ozkaya A, et (2018) Assessment of the macula and choroid in pediatric keratoconus patients. Saudi J Ophthalmol 32: 126-129.
- Margolis R, Spaide RF (2009) A pilot study of enhanced depth imaging optical coherence tomography of the choroid in normal Am J Ophthalmol 147: 811-815.
Citation: Fahmy RM, AlGhamdi MS, Mostafa AM (2021) The Correlation between Choroidal Thickness and Keratoconus Severity among Saudi Population (Albaha). J Ophthal Opto 3: 009.
Copyright: © 2021 Fahmy RM, et al. This is an open-access article distributed under the terms of the Creative Commons Attribution License, which permits unrestricted use, distribution, and reproduction in any medium, provided the original author and source are credited.