*Corresponding Author:
Dimitri Scholz,
Conway Institute, University College Dublin UCD, Belfield, Dublin 4, Ireland
Tel: +353877961547
E-mail: dimitri.scholz@ucd.ie
Abstract
Photodynamic therapy is an emerging treatment used for certain types of cancer, where a photosensitizer drug generates a phototoxic effect on cells when exposed to light of a certain wavelength. Hexvix is a photosensitizer used in blue light cystoscopy, used to detect bladder cancer facilitating diagnosis and treatment of this disease. This compound is selectively absorbed by cancer cells and not by normal cells. Illuminated with blue light, Hexvix emits red light, resulting in detection of cancer cells. In this work the potential of Hexvix to label and kill multiple cancer cell lines is tested, for potential clinical applications in photodynamic therapy. Here a microscopy cell-based assay was established with automated cell quantification and analysis, to investigate the photodynamic toxicity of Hexvix tested on six cell lines: two non-cancerous (MDCK and HEK293) and four cancer cell lines (bladder cancer (5637), prostate cancer (PC3), colon cancer (SW480) and breast cancer (MDA-MB-231). Results show a higher sensitivity to Hexvix treatment in three cancer cell lines (bladder, prostate and colon cancer) at lower light doses than in non-cancer cell lines. On the other hand, a breast cancer cell line showed low response to the treatment, indicating that the Hexvix phototoxic effect varies between cell types and requires evaluation for each case. The phototoxicity assay presented in this study can be applied as a new clinical diagnostic approach prior to photodynamic treatment.
Keywords
Photodynamic therapy, Photosensitizers
Abbreviations
5-ALA : 5-aminolevulinic acid
HAL : Hexaminolevulinate
PAPs : Photoactive Porphyrins
PI : Propidium Iodide
ROS : Reactive Oxygen Species
Introduction
Photodynamic therapy is growing as an alternative treatment for different types of cancer, like an invasive bladder cancer. Photodynamic therapy is a technique that consists basically of two components a photosensitizer drug and specific illumination which individually result in little to no toxicity. When both are combined they induce a photochemical reaction inside the cell and in the presence of oxygen generate oxygenated products like superoxide (·-O2), Hydrogen Peroxide (H2O2) and Hydroxyl Radicals (˙OH). These Reactive Oxygen Species (ROS) cause toxicity and finally cell death [1,2]. ROS generated through these mechanisms accumulate inside malignant cells, close to mitochondria since protoporphyrin IX is synthesized in this organelle [3], and subsequently, ROS oxidize intracellular molecules therefore destroying cells. The photodynamic toxicity is due to ROS which have high reactivity with short half-life time (<0.04μs) [1]. Photodynamic therapy can be used along with other common cancer treatments such as surgery, chemotherapy and/ or radiotherapy without affecting its performance, but the characteristic adverse effects of these therapies are absent in photodynamic treatment [2]. This technique can also be delivered to the patient in an ambulatory way, reducing health costs associated with treatment compared with other therapies. Clinical applications of photodynamic therapy in other fields of medicine include treatments of age related macular degeneration and other eye diseases in ophthalmology, and also applications in cardiology, dermatology and rheumatology [1].
Hexvix (hexaminolevulinate hydrochloride) is a compound produced by Photocure [3] ASA (Oslo, Norway) and is FDA-approved for photodynamic detection of cancer cells in the bladder in United States and Europe. This technique improves the quality of bladder cancer diagnosis by enhancing the contrast between normal and tumour tissue, based on the fluorescence properties of Photoactive Porphyrins (PAPs) and their affinity to malignant cells [4]. Hexaminolevulinate (HAL) is a derivative of 5-Aminolevulinic Acid (5-ALA), being a precursor of PAPs, mainly protoporphyrin IX. After incubation of Hexvix on bladder, protoporphyrin IX generated inside the cancer cells emits red light fluorescence under blue light (400 nm) illumination. The intake of HAL administration turned out to have increased preference on cells with a high rate of proliferation, such as neoplastic tissues [5,6], although the mechanisms involved in their selectivity is not yet clear. This effect allows the application of this compound in photodynamic diagnosis of non-invasive bladder cancer and also helps guide surgical resectioning of malignant tissue.
The extent of the photo-damage and cytotoxicity of photodynamic therapy relies mainly on the photosensitizer used, along with other factors such as photosensitizer concentration, tissue and intracellular localization, time and dose administrated, light exposure and drug incubation time prior to photodynamic therapy [1].
The aim of this study is to evaluate Hexvix as a potential candidate for photodynamic therapy by selectively killing cancer cells, while leaving normal cells intact. This will be carried out using blue light (405nm), currently used for photodynamic diagnosis. We established a microscopy cell-based assay with automated cell quantification and analysis to investigate the photodynamic toxicity of Hexvix. A range of Hexvix concentrations and blue light exposure times have been tested throughout this assay, using two non-cancer and four cancer cell lines. This is to evaluate the potential of Hexvix to label and kill malignant tissue other than non-cancerous cells, and its potential clinical application.
Materials and Methods
Cell culture
Six different cell lines were studied (Table 1). All cell lines were maintained in Dulbecco’s Modified Eagles’s Medium with phenol red (DMEM, Sigma, D5546) supplemented with 10% fetal bovine serum (Sigma, F7524), 100 μg/mL penicillin, 100 μg/mL streptomycin (Sigma, P4333) and 2mM GlutaMAX (Gibco, 35050-061). Cells were kept for incubation at 37°C, 5% CO2 in a humidified atmosphere.
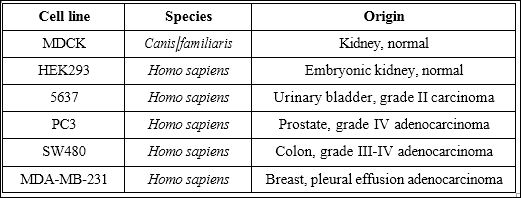
Table 1: Summary of cell lines used.
For trypsinization, DMEM medium was removed and cells were washed three times with phosphate buffered saline solution (PBS, Thermo Scientific, BR0014) pH 7.4. After washing, cells were incubated with 0.25% Trypsin-EDTA with phenol red (Gibco, 25200-056) for 5 minutes at 37°C. Cell detachment was checked by observation under the microscope and counting was performed manually using an haemocytometer slide as described elsewhere [7]. 200μL of 100,000 to 200,000 cells/mL suspensions were seeded on 96 well plates in DMEM pre-warmed to 37oC DMEM medium for Hexvix phototoxicity experiments on 96 well plates (Ibidi, 89626) and left in the incubator overnight for cell attachment and spreading.
Hexvix treatment
For bladder instillation using blue light cystoscopy in the clinic, 50mL of 8mM Hexvix reconstituted solution is used and incubated one hour prior to cystoscopy diagnosis [6,8]. Due to the difference between in vitro cell monolayers and tissue in vivo, it was decided to evaluate Hexvix phototoxicity at multiple concentrations, starting with a 1:20 dilution of Hexvix (400μM), to define optimal concentra- tions for subsequent experiments. After overnight incubation, DMEM medium was removed and cells were washed once with pre-warmed PBS and 200μL of DMEM medium was added to the control wells, whereas 200μL of DMEM + Hexvix (Ipsen, Photocure ASA, Oslo, Norway) was added to the other wells in the following concentrations: 400μM, 50μM, 25μM, 1μM or 5μM. In order to detect and quantify dead cells throughout the experiment, 0.5mM Propidium Iodide (PI, Cayman Chemical Company, 10008351) was also added to cells in this step. Cells were then incubated 1-1.5 hours prior to image acquisition and light treatment, at 37°C, 5% CO2 in a humidified atmosphere. Distribution of wells and experiment setup can be observed in Supplementary figure 1.

Supplementary Figure 1: Image acquisition setup. Seeded cells were incubated for 1-1.5 hours with the correspondent Hexvix concentration, together with 0.5mM of PI for cell death detection. After, image acquisition and light treatment was per- formed, acquiring 3 different channels in each position: DIC bright field, Photo por- phyrin IX (PpIX) signal by 405nm light illumination and PI signal by 560nm light illumination. 405nm light treatment was applied for 5, 3 or 1 second during the image acquisition process, and no 405nm light was used a control. Three positions were imaged by each well 50 times. Each cell line was treated separately according to this setup.
Image acquisition
Fully automated inverted Nikon Eclipse Ti-E microscope (Nikon, Japan), equipped with a live cell incubation chamber, a 10x Plan Apo N.A. 0.45 DIC dry objective was used for imaging using epifluores- cence via a TIRF condenser allowing sample exposure to non-filtered maximal laser light. Detection was performed using an Andor EMCCD camera iXon model 885 (Oxford Instruments, Belfast, United Kingdom). Images were acquired using Andor iQ3.3 (Oxford Instruments, Belfast, United Kingdom). Time-lapse images were acquired every 10 minutes for 500 minutes, generating a set of 50 frame sequences per field (in TIFF format) for analysis. Each well was sampled in three different fields of view.
Images were acquired in three channels: 1) Transmission light differential interference contrast (DIC) to image cell morphology and count total cells. Light source = tungsten bulb 100W, 2) Fluorescent light detection with 600nm LP emission filter upon 560nm solid state laser illumination (laser output power 50mW) to detect PI signal from dead cells, and 3) Fluorescent light detection with 593nm LP emission filter upon 405nm solid state laser illumination (laser output power 100mW), to detect protoporphyrin IX signal from Hexvix positive cells. Additionally, for photodynamic treatment, cells were exposed to 405nm (laser output power 100mW) illumination for five, three or one second. No signal was detected by this illumination. Detailed experiment setup can be observed in Supplementary figure 1.
Image processing and cell counting
Images acquired were firstly processed using Image J/Fiji software (National Institute of Health, USA), then the processed images were used for automated cell counting using Cell Profiler software ver- sion 2.1.1 (National Institute of Health, USA). Total cell counting was obtained from DIC images and dead cell counting was obtained from PI positive cells. Details of processing and Cell profiler pipeline settings can be found in supplementary materials section.
For time-lapse images and video file preparation, bright field DIC images were improved by flat field correction as described previously and fluorescence images were improved by background subtraction tool with rolling ball of 50px in Fiji software.
Data analysis
Data acquired using Cell Profiler software was sorted using Microsoft Excel 2007 Software. To obtain dead cell fractions, total dead cell counts were divided by total cell value. Three images per well/condition were taken. The triplicate values were averaged and standard deviation values were calculated.
To determine accuracy of automated cell counting, cells were manually counted in one image from five separate wells for each cell line. These values were compared to the automated counting values of the same set of images. To obtain accuracy percentage Equation 1 was used based on binary classification [9].

True positives: manually counted cells, true negatives: none, false positives: value of automated counted cells over manually counted cells, false negatives: value of automated counted cells under manually counted cells.
Accuracy percentages are described in table 2. Based on these values it was considered this type of image processing and automated counting was an appropriate technique for counting DIC images of adherent cells, therefore all image results were achieved using this method.

Table 2: Percent accuracy of automated cell counting using Cell Profiler software compared to manual counting for each cell line studied, using pre-processed bright field DIC images.
Statistics
2-way ANOVA and Bonferroni post test with a 5% significance level was used for the statistical calculations. Results are expressed as mean ± Standard Error of the Mean (SEM).
Results
Hexvix at 10-50μM is the effective concentration range for a photodynamic effect in bladder carcinoma cells in vitro
Non cancerous cell line MDCK and bladder cancer cell line 5637 were treated with different concentrations of Hexvix, ranging from 400μM to 5μM, in order to define the window of optimal concentrations to be used in the following photodynamic experiments.
In a time-lapse experiment (Supplementary video 1 and 2) it is clearly visible how damaged cells round up before the uptake of PI and remain PI positive. On healthy cells, Hexvix alone without blue light illumination did not harm either the cancer or non-cancer cells over the full range of concentrations (Figure 1A).
http://www.henrypublishinggroups.com/supplementary-video-1/
Supplementary Video 1: Time-lapse video of non-cancer Kidney cells (MDCK) treated with 400 μM of Hexvix and 5 sec blue light (405 nm) illumination every 10 minutes, over a period of 8 hours. Green= PAPs, red = PI, scale bar = 100μm.
http://www.henrypublishinggroups.com/supplementary-video-2/
Supplementary Video 2: Time-lapse video of bladder cancer cells (5637) treated with 400 μM of Hexvix and 5 sec blue light (405 nm) illumination every 10 minutes, during 8 hours. Green= PAPs, red = PI, scale bar = 100 μm.
However, if blue light illumination follows Hexvix uptake (Figure 1B), cell death occurs, more notoriously on cancer cells (5637) than in the control cell line (MDCK). At the highest Hexvix concentration (400μM), control cells showed 73% cell death, but fell beneath 10% (background level) in lower concentrations. The cancer cell line showed cell death at 93% at the highest concentration of Hexvix, followed by a slow decline of 79, 78, 38 and 18% cell death at the other corresponding Hexvix concentrations. Thus, there is a broad window of concentrations (5-50μM) at which the combined effect of Hexvix and blue light kill cancer cells but not non-cancer cells.
In cancer cells treated with 10μM Hexvix cell death was not obvious, but cells stopped moving and shrank as a stress response. Interestingly, such cells demonstrated Hexvix fluorescence signal under these conditions, indicating intracellular uptake. Only cells with the strongest observed signal (therefore increased Hexvix uptake) die.
Based on these results, 400μM was used as a positive control concentration for Hexvix, where cell death would be triggered in monolayer cultures independently of the cell type treated. Also 50-5μM concentrations were used in order to reveal phototoxicity profiles for each cell lines in order to detect the threshold value of concentration for each cell type.
These results show that it is not light alone (or light intensity) that kills cells but its combination with Hexvix, as the absence of the compound (control) shows low cell death unrelated to the treatment.
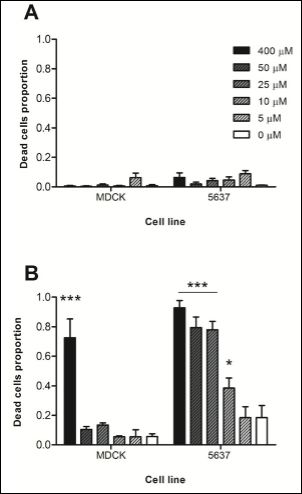
Figure 1: Effect of Hexvix concentration on cell survival.
MDCK and 5637 cells were treated with 400, 50, 25, 10 or 5μM Hexvix and monitored for 8 hours. A) No blue light illumination, B) 5 sec blue light (405 nm) illumination every 10 minutes. Dotted line indicates 80%. A small amount of dead cells was present at the beginning of the experiment, independent of Hexvix or illumination treatment. The graph shows mean ± SEM, n=1 triplicate. *** p> 0.001, * p> 0.05.
Hexvix+light killed bladder cancer cells but not non-cancer cells at lower illumination doses
As an illumination dose at specific light wavelength is a factor effecting photodynamic therapy [2], cells were treated with previously defined concentrations of Hexvix using blue light impulses at varying time lengths (Figure 2). After eight hours of cumulative treatment non-cancer cells showed a higher tolerance when compared to cancer cells to specific illumination throughout all Hexvix concentrations.
Three-second exposure times of blue light with both 400μM and 50μM Hexvix concentrations triggered more than 80% cell death. Similar values were observed using five-second exposure times at the same concentrations. Using a one second exposure time every 10 minutes, 400μM Hexvix treatment reached 64.7% cell death in the 5637 cell line. This was 60% higher than the response observed in MDCK cells (Figure 2).
Hexvix photodynamic treatment is effective against three different cancer cell types
Four cancer cell lines: bladder cancer (5637), Prostate Cancer (PC3), colon cancer (SW480) and breast cancer (MDA-MB-231) as well as two non-cancerous cell lines (MDCK and HEK293) were tested in order to investigate the photodynamic effect of Hexvix on each of them. Figure 3 shows that each cancer cell line has a specific response to Hexvix photodynamic treatment, which was efficient against bladder cancer (5637), Prostate Cancer (PC3) and colon cancer (SW480) and showed a decreased effect against breast cancer (MDA-MB-231) and non-cancerous cell lines (MDCK and HEK293).
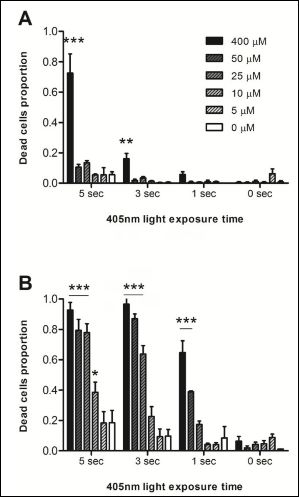
Figure 2: Cell survival rate following Hexvix treatment.
MDCK and 5637 cells were treated with 400, 50, 25, 10 or 5 μM Hexvix and then exposed to blue light (405nm) repetitively with 1-5 sec impulses every 10 minutes over the course of 8 hours (a total of 48 impulses). MDCK cells were more tolerant than 5637 cells to photodynamic treatment. The graph shows mean ± SEM, n=1 triplicate. *** p > 0.001, ** p > 0.01, * p > 0.05.
The second non-cancer cell line tested, HEK293, had a higher sensitivity to the photodynamic effect of Hexvix when compared to MDCK cells. This cell line showed a 74% and 60% cell death at 400μM and 50μM Hexvix respectively, using the higher dose of blue light (five seconds) exposure (Figure 3B). With three-second light exposure, cell death reached 78% at 400μM Hexvix concentration, almost 70% higher than MDCK cells under the same conditions. This increased sensitivity represents a problem in the potential application of Hexvix as a photosensitizer for photodynamic therapy, as the treatment could also damage normal tissue with this level of sensitivity. On the other hand, results with breast cancer cells (MDA-MB-231, Figure 3D) show a low sensitivity to photodynamic treatment, when compared to bladder cancer cells (positive control). At three second light exposure, there was a 40% cell death rate for this cell line, 46% lower than the 5637 cell line and 38% lower than HEK293. This decreased sensitivity to photodynamic treatment with Hexvix could be a problem in clinical applications if highly sensitive normal tissue is combined with low sensitivity malignant tissue.

Figure 3: Effect of blue light combined with Hexvix (photodynamic treatment) on cell survival in six different cell lines. (A-F) Indicated cells were treated with 400, 50, 25, 10 or 5μM of Hexvix for 60 to 90 minutes followed by 5, 3 or 1 sec blue light (405nm) illumination every 10 minutes and monitored over the course of 8 hours. A) MDCK; B) HEK293; C) 5637; D) MDA-MB-231; E) PC3; F) SW480. The graph shows mean ± SEM, n=1 triplicate. *** p > 0.001, ** p > 0.01, * p > 0.05.
Figure 3 highlights that cancer cell lines PC3 and SW480 are highly sensitive to photodynamic treatment using Hexvix, even higher than the positive control 5637 cell line. Prostate Cancer (PC3) cells show 98% and 97% cell death at 400μM and 50μM Hexvix respectively when treated with five-second exposures to blue light. When treated with three-second exposures of blue light cell death reaches 90% and 87% at the same Hexvix concentrations. This rate of cellular toxicity is ideal for optimal photodynamic therapy application, where cancerous cells are surrounded by normal tissue with low sensitivity to the same treatment. Similar to these results, colorectal cells (SW480) show 98% and 94% cell death at 400μM and 50μM Hexvix respectively when treated with five second exposures to blue light. When treated with three-second exposures, cell death reaches up 83% and 88% at the same Hexvix concentrations. These two cancer cell lines also show a response at one-second exposures, with cell death at 80% in SW480 cells at 5μM and 25μM Hexvix treatment. The PC3 cell line also shows a response under these conditions with 73% and 78% cell death respectively.
Strong morphological changes were observed in the different cell lines during photodynamic treatment with Hexvix and blue light, similar for all cell lines. Figure 4 shows the three-step process that was observed in every cell line from normal state to death. When the photodynamic treatment is effective, cells die and follow a series of morphological changes: firstly, cells shrink and partially detach from the surface, taking a rounded shape; during this process stress fibers can be observed in some cells (Figure 4, PC3 cells). Later, blebs formation can be observed; these blebs grow and fuse, looking at the end like a halo around the cells. After this, cells appear flattened and PI emission show up, which means cell membrane becomes permeable confirming the cell death [10].
As seen in Figure 4, the morphological changes were observed in all cell lines studied when death is the final fate of the cell. This indicates that all cell lines, with no matter of its origin, follow similar mechanism that drives to cell death when photodynamically treated using Hexvix and blue light illumination.
Discussion
This study proposes that Hexvix treatment combined with blue light (405nm) has possible applications as a photosensitizer drug on different cancer cell lines, not only bladder cancer cells, for clinical photodynamic therapy. In order to test the potential of Hexvix, an image-based assay was designed and applied to two non-cancer cell lines and four cancer cell lines of different origin. Hexvix photodynamic treatment was strongly effective on three cancer cell lines tested (bladder, prostate and colon cancer cell lines), with a low effect observed in non-cancer cells (dog kidney and human embryonic kidney) along with breast cancer cells, within a concentration range from 400μM to 5μM Hexvix combined with a light dose exposure time from five to one second every 10 minutes. These results suggest Hexvix has a potential to label and kill other cancer cells, in addition to bladder cancer cells.
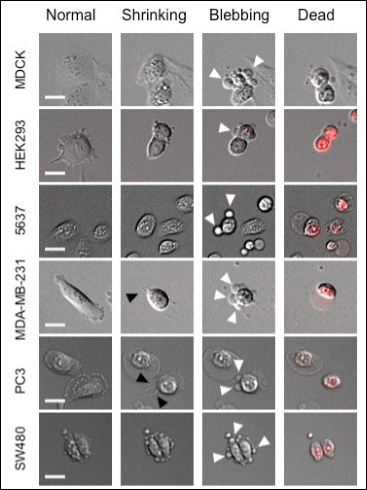
Figure 4: Morphological changes observed on different cell lines during photodynamic treatment using Hexvix. Photodynamic treatment using 400μM Hexvix combined with 5 sec 405nm light exposure was monitored for 6 cell lines. In the process of cell death, cells shrink and show stress fibers (black arrows) and “blebs” formation (white arrows). Cell death is confirmed by PI emission (red). Scale bar = 20μm.
Figure 3 summarizes the results obtained for the 6 cell lines tested, showing different response patterns. Prostate Cancer (PC3) and colon cancer (SW480) cell lines showed the highest cell death rates with Hexvix treatment, suggesting potential clinical applications of Hexvix photodynamic effect for treatment of these diseases. Among non-cancer cells a variation of sensitivity to Hexvix was observed. The Human Embryonic Kidney (HEK293) cell line showed an increased sensitivity to treatment when compared to the MDCK cell line, though still less sensitive than cancer cells. This relatively high sensitivity could represent a problem for the potential application of Hexvix as a photosensitizer for photodynamic therapy, as the treatment could damage normal tissues.
In Figure 3E and 3F, the calculated cell death values were below 100% even in such sensitive cell lines, where total cell deaths was expected (and most probably happened) at the highest concentration Hexvix and the highest blue light dose. This could be explained by the systematical error associated with the cell counting method used in this image-based assay (Table 2). For the values discussed here, an approximate 10% of accuracy error must be considered which may lead to these differences in the values presented. However, difference between treated cells and controls without Hexvix compound are still statistically significant, indicating the photodynamic effect of Hexvix along with blue light treatment.
As mentioned before, the mechanism for preferential Hexvix uptake by malignant cells is not yet clear, but it is proposed that it relies on the proliferative properties of the cells [5,6]. According to this, the higher phototoxic effect of Hexvix on the HEK293 cell line may be explained by its embryonic nature, in contrast to MDCK cells and their different response to Hexvix treatment. It must also be noticed that HEK293 cells are a transformed cell line with many altered regulatory pathways, usually being considered aa low-tumorigenic cell line [11]. Performing a test in a primary culture of non-cancer urothelial mucosa could be an interesting alternative as a control for the photodynamic therapy application with Hexvix, in order to define the appropriate dose for each case.
Photo-damage and cytotoxicity depend on many factors such as the type and concentration of the sensitizer used, sensitizer localization in the cell, oxygen availability, light exposure dose, light fluence (radiant energy received by cells surface) and time of incubation before light exposure [1]. During routine blue light cystoscopy the light doses applied vary. Typical total light doses (white light and blue light) range between 180J and 360J at an intensity of 0.25 mW/cm2 [4]. This light intensity is more than 100 times lower than the maximum laser intensity estimated during this study (100 mW/cm2). Even so, the phototoxic effect of Hexvix is only observed when combined with blue light illumination (Figure 1). In the absence of blue light during treatment with 400μM Hexvix, little to no cell death was observed, nor was any signal of cell distress such as shrinking; in these conditions cells behave normally, moving around and dividing (data not shown). These results indicate that the photodynamic effect of Hexvix is only generated if Hexvix and blue light are combined as treatment on these cells, but not if these components are applied alone, also indicating that Hexvix acts in a concentration dependent manner. Other factors, however, such as tissue heating caused by the intense light and phototoxicity not triggered by the photo sensitizer, must be considered, as such factors could participate in total cell death observed in Hexvix photodynamic treatment. Figure 2 results also indicate that the phototoxic effect depends not only on Hexvix concentration but also on light exposure times. Therefore this defines the threshold dose for treating cancer cells without damaging normal tissue. Moreover, different cell lines exhibit different responses to Hexvix treatment, indicating that other cell lines might be more or less sensitive to photodynamic treatment using Hexvix as photo sensitizer.
However accumulation of oxygenated products inside malignant cells leads to cell death [1,2], further experiments are required to determine which radical is the most responsible for cell death due to the Hexvix photodynamic effect. Photodynamic effect occurs under different mechanisms [1], and reactions occur simultaneously and predominance of one or the other depends on the type of photosensitizer, its concentration along with oxygen and substrate concentration, and the binding affinity of these molecules [12].
Significant changes in the morphology of the cells were observed along Hexvix photodynamic treatment. Cell shrinkage, a hallmark of apoptosis, can be observed in Figure 4, followed by what could be the generation of apoptotic or necrotic blebs, based on literature description of the cell death process on mammalian cells [11]. These results agree with literature, that describes that cell death by phototoxicity leads to tumor cell death via an apoptotic, necrotic or autophagic mechanisms [2]. Further studies on Hexvix phototoxic effect should include pathway research using apoptotic or necrotic markers, to elucidate which is the mechanism involved in cell death triggered by Hexvix photodynamic treatment.
The Hexvix compound does not meet all the requirements of an optimal photosensitizer; for example its absorption is in the range of the 380-450nm, far from the 650nmto 805nm proposed by Plaetzer [12]. The overall results indicate that response to Hexvix photodynamic treatment using blue light is tissue-dependent and the sensitivity to the treatment may vary. However, the mechanism lying behind the interaction between the photosensitizer drug and malignant tissue is still not fully clear. Nonetheless, results shown here are promising to propose Hexvix as a candidate for its application in photodynamic therapy, to treat different types of cancer. Further studies on the phototoxic effect of Hexvix should include the sensitivity ratio of tumour and the surrounding tissue in vivo and in vivo experiments after tumour resectioning, in order to set up treatment parameters such as the appropriate Hexvix concentration and blue light exposure times, in the light of possible future clinical applications along with broadening its application to other cell types.
References
- Dolmans DE, Fukumura D, Jain RK (2003) Photodynamic therapy for Nat Rev Cancer 3: 380-387.
- Agostinis P, Berg K, Cengel KA, Foster TH, Girotti AW, et (2011) Photody- namic therapy of cancer: an update. CA Cancer J Clin 61: 250-281.
- Hexvix press kit [press release].
- O’Brien T, Thomas K (2010) Bladder cancer: Photodynamic diagnosis can improve surgical outcome. Nat Rev Urol 7: 598-599.
- Hamblin M, Huang Y (2013) Handbook of photomedicine: Taylor &
- Frampton JE, Plosker GL (2006) Hexyl aminolevulinate in the detection of bladder cancer: profile report. BioDrugs 20: 317-320.
- Stoddart MJ (2011) Mammalian Cell Viability. Methods and Protocols. New York Dordrecht Heidelberg London: Humana Press.
- Bader MJ, Stepp H, Beyer W, Pongratz T, Sroka R, et al. (2013) Photody- namic therapy of bladder cancer - a phase I study using hexaminolevulinate (HAL). Urol Oncol 31: 1178-1183.
- Metz CE (1978) Basic principles of ROC analysis. Semin Nucl Med 8: 283-298.
- Celis J (1998) Cell A laboratory handbook.
- Stepanenko AA, Dmitrenko VV (2015) HEK293 in cell biology and cancer research: phenotype, karyotype, tumorigenicity, and stress-induced ge- nome-phenotype evolution. Gene 569: 182-190.
- Plaetzer K, Krammer B, Berlanda J, Berr F, Kiesslich T (2009) Photophysics and photochemistry of photodynamic therapy: fundamental aspects. Lasers Med Sci 24: 259-268.
Supplementary Methods
Image processing
The pipeline of image processing for bright field and fluorescence images is depicted in Supplementary Figure 2. DIC images acquired were firstly processed using Image J/Fiji software (National Institute of Health, USA), where a flat field correction for DIC was applied to images using a Gaussian blur of a radius of 100 px and dividing this image to its original using the Calculator Plus tool in Fiji, using as k1 value the mean gray intensity value from the blurred image. After this, the image was sharpened to exploit texture from DIC image using Sharpen process tool and finally the contrast was enhanced automatically using Enhance Contrast process tool, with a saturated pixel value of 0.5%.
Processed DIC images were used for automated total cell counting using Cell Profiler software version 2.1.1 (National Institute of Health, USA), originally designed for fluorescence images. To do so, images were also processed in this software according to the pipeline (Supplementary Figure 2). Image Load module was used to load the TIFF movies generated, using default configuration for TIFF movies with one channel. For processing, Image Math module using invert operation was applied to invert image colors, Enhance or SupressFeatures module was used to enhance DIC features with a smoothing scale of 0.5, shear angle of 0.0 and decay value of 0.75. Enhance Edges module was used based on the Prewitt edge-finding method, as it was the one that performed the best, enhancing in all directions. After processing, cell segmentation was performed using the Identify Primary Objects module with a diameter of the objects of minimum 20px and maximum of 100px. Objects outside this range were excluded from counting. Objects touching the border of the image were not discarded and the thresholding strategy was adopted with a background method and an adaptive window size was calculated by image size. The smoothing method for thresholding was automatic with a corrector factor value as 1.0 with a minimum of 0.0 and a maximum of 1.0, as this configuration performed the best. The method to distinguish and draw dividing lines between clumped objects was based on the shape of the objects and the system was setup to automatically calculate the size of the smoothing filter after declumping and to calculate the minimum allowed distance between local maxima. No low-resolution images were used to find the local maxima or were outlines of the identified objects retained. After image segmentation Export to Spreadsheet module was used to save the results obtained, using the default settings.
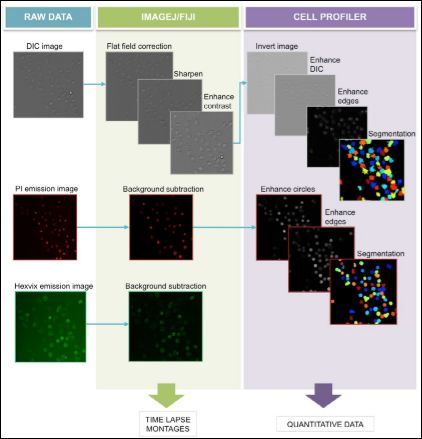
Supplementary figure 2: Image processing pipeline. Bright field and fluorescence images were processed in order to enhance automated counting, using Image J/Fiji and Cell Profile software. Quantitative and qualitative (time-lapse) data was acquired from these images.
Fluorescence images corresponding to PI signal in dead cells were processed using Fiji software to subtract background, using background subtraction tool with rolling ball of 50px. After this, images were used for dead cell counting using Cell Profiler software. Image Load module was used to load the TIFF video files generated, using default configuration for TIFF videos with one channel. For processing, Enhance or Supress Features module was used to enhance circles with a feature size of 10, in order to prevent detection of smaller circles inside the stained nuclei. Also Enhance Edges module was used, based on the Sobel edge-finding method enhancing in all directions. After processing, cell segmentation was performed using the Identify Primary Objects module with a diameter of the objects of minimum 20 px and maximum of 100 px, objects outside this range were excluded from counting. Objects touching the border of the image were discarded and the thresholding strategy was Adaptive with a Background method, where adaptive window size was calculated by image size. Smoothing method for thresholding was Automatic with a corrector factor value as 1.0 with a minimum of 0.0 and a maximum of 1.0, as this configuration performed the best. The method used to distinguish and draw dividing lines between clumped objects was based on the intensity of the objects and the system was setup to automatically calculate the size of the smoothing filter after declumping and to calculate the minimum allowed distance between local maxima. No low-resolution images were used to find the local maxima nor were outlines of the identified objects retained. After image segmentation Export to Spreadsheet module was used to save the results obtained, using the default settings.
Citation: Salgado CN, Habington P, Itasaki N, Scholz D (2016) Photodynamic Application of Hexvix for Cancer Therapy. J Cell Mol Biol 1: 002.
Copyright: © 2016 Salgado CN, et al. This is an open-access article distributed under the terms of the Creative Commons Attribution License, which permits unrestricted use, distribution, and reproduction in any medium, provided the original author and source are credited.