*Corresponding Author:
Cristina Campoy,
School of Medicine, Av. de la Investigación, 11, 18016, Granada, Spain
E-mail: ccampoy@ugr.es
Abstract
Background and Aims: Human milk oligosaccharides are the third most abundant solid component of human milk and are associated with multiple health benefits. Whether or not certain maternal factors influence human milk oligosaccharide concentrations remain unclear.
Methods: In a pilot study, human milk samples from overweight, obese, normal weight and gestational diabetic mothers in the PREOBE study were collected at 1 month postpartum. Eighty- two samples were analyzed by UHPLC-MS/MS to determine 2´-fucosyllactose (2´-FL) and 6´-sialyllactose (6´-SL) concentrations. Neurodevelopment of infants from mothers providing human milk samples was assessed by Bayley III scales at 6 and 18 months of age.
Results: No significant differences were found in 2´-FL or 6´- SL levels among study groups. A positive association was found between 6´-SL human milk concentration and cognitive and motor scale scores in infants at 18 months of age. An association between 2´-FL concentration and motor score at 6 months of age was found although was not significant in Low and High 2´-FL groups, separately.
Conclusions: 6´-SL and 2´-FL levels were not influenced by pre- conceptional maternal body mass index or the development of gestational diabetes mellitus. 6´-SL and 2´-FL levels in human milk were associated with infant cognitive development.
Keywords
2’-fucosyllactose; 6’-sialyllactose; Brain; Gestational diabetes mellitus; Human milk oligosaccharides; Maternal pre-gestational weight
Introduction
Human milk is the “Gold Standard” for term and preterm infant nutrition. Its unique composition is associated with multiple health benefits in human milk fed infants. Human milk composition is dynamic and changeable and depends on different factors such as preterm delivery [1], lactation stage, day, time [2] and some maternal variables such as parity, age, smoking habits, weight [3,4] or diet [5].
Substantial evidence suggests that maternal weight status may have an impact on human milk composition. Total protein and total carbohydrate content of human milk do not differ between overweight/obese women compared to normal weight women [6,7]. However, there are inconsistencies regarding fat content. Some studies report caloric density and total fat are the same in human milk of overweight/obese and normal weight women [6-8] while others report significant differences with higher values in milk of overweight/obese women [9,10]. Several studies report differences in human milk fatty acid profiles of overweight versus normal weight mothers: overweight/obese mothers showed a lower content of n-3 Long Chain Polyunsaturated Fatty Acids (LCPUFAs), higher content of n-6 LCPUFAs [8,11-13], lower Monounsaturated Fatty Acids (MUFAs), higher amounts of Saturated Fatty Acids (SFAs) and lower PUFAs than normal weight mothers. Other molecules such as insulin, leptin [7,14,15], TNF-α, IL-6 [16,17] and glucose [10,16,17] have been reported to be higher in overweight/obese mother´s milk. Human milk microbiome is also conditioned by maternal weight; a different microbiota profile and a lower diversity in human milk from obese women compared to human milk from normal-weight mothers have been observed [18-20]. Other maternal conditions such as diabetic status have been related to different human milk fat profiles compared to a reference group associated with changes in lipid metabolism [21]. Based on these macronutrient studies, the fat fraction of human milk is the most impacted by maternal variables such as overweight/obesity or diabetes.
Regarding carbohydrates, the total content is the same regardless of maternal weight [6,7]; however, little is known about the effect of those maternal conditions on the subset of human milk carbohydrates. The carbohydrate composition of human milk consists of lactose, as the main carbohydrate, with a concentration ranging from 67 to 78 g/L, and a diversity of oligosaccharides, which comprise approximately 10 g/L in human milk [2]. Human Milk Oligosaccharides (HMOs) significantly decrease through lactation: HMO concentrations have been reported to be 20–25 g/L in colostrum and reach 5–20 g/L in mature milk [22,23]. A recent research by Xu and coworkers showed that the concentration of HMOs at the 10th day of lactation was 19.3 ± 2.9 g/L and then decreased to the value 8.53 ± 1.18 g/L at the 120th day of lactation [24]. Not only lactation stage but also the delivery date has been noted as an important factor influencing HMO concentration. The concentration of total HMOs in preterm milk from days 10-23 of lactation was nearly two-fold lower than in term milk in the same period of lactation (3.6 g/L and 6.1 g/L, respectively). Recent research also showed important differences between preterm and term milk in mothers at the same postmenstrual age [25].
HMOs are the third most abundant solid component of human milk after lactose and lipids [26]. Mammalian milk oligosaccharides include acidic oligosaccharides, mainly sialylated such as 6’-sialyllactose (6´- SL), or neutral oligosaccharides, mostly represented by fucosylated compounds, such as 2´-fucosyllactose (2’-FL). Fucosylated glycans are the most abundant form in human milk while sialylated structures represent 10–20% of total human milk oligosaccharides [27]. The fucosylation process of glycans in human milk depends on the status of the mother regarding Secretor and Lewis histo-blood group systems: the secretor gene encodes α1-2 fucosyltransferase (FUT2), an enzyme that transfers a fucose residue to a terminal galactose in an α1-2 linkage giving rise to α1-2 fucosylated compounds, such as 2´-FL, present in maternal secretions such as saliva (H antigen), tears (H antigen), and milk (2´-FL). Lewis gene encodes the α1- 3/4fucosyltransferase (FUT3) which transfers a fucose residue to glucose or an N-acetylglucosamine molecule in α1-3 or α1-4 linkages, producing compounds such as 3´- fucosyllactose (3´-FL) [28]. Thus, 2’-FL is not present in all human milk and its existence depends on the secretor status of the mother. Non-secretor subjects lack 2’-FL among other HMOs in their milk; however, some studies have shown low concentrations of α1-2 fucosylated compounds in milk from non- secretor mothers [29-31]. It has been suggested that although most non-secretor individuals have a non-functional FUT2 mutation, other FUT2 mutations may preserve certain enzyme activity [32]; another hypothesis could be the existence of alternative routes for the synthesis of 2´-FL [33].
In secretor milk, 2´-FL is typically the most abundant oligosaccharide [28] and 6´-SL; together with 3´-sialyllactose (3´-SL) are predominant sialylated compounds [34]. 2´-FL concentration in human milk ranges from 0.004 to 6 g/L and 6’-SL varies from 0.011 to 1.57 g/L [23,32,33,35-39]; both compounds levels decrease through the lactation period [23,34].
Aside from lactation stage, delivery date or genetic secretor/non- secretor status little is known about how other maternal factors or the environment may influence HMO composition. Azad and coauthors recently investigated the association between fixed and modifiable factors with HMO concentrations, and important variations within secretor groups were found indicating other factors may influence HMO composition; in fact, an association between HMO concentration and lactation stage, parity, ethnicity, city of residence, season or exclusive human milk feeding was found. On the contrary, maternal diet seemed not to influence HMO composition [40].
Few studies have assessed the effect of maternal overweight/ obesity or diabetic status on the distribution of carbohydrates in human milk, and specifically on human milk oligosaccharide profiles. Smilowitz et al. carried out a study in which milks from mothers with and without Gestational Diabetes Mellitus (GDM) were analyzed for HMO abundance including other variables; results showed there were no differences in HMO composition between the 2 groups [41]. Isganaitis et al. reported that maternal obesity was associated with differences in human milk oligosaccharide content and composition in human milk at 1 month postpartum [9]. In a recent study in which mature human milk samples from 78 mothers were analyzed, 2´-FL concentration was significantly correlated with Pre-gestational Body Mass Index (pBMI) in secretor mothers [42].
HMOs have been linked to multiple biological functions such as effects on immune system and gastrointestinal development [43,44], anti-infective and bifidogenic activity [45-47], modulation of inflammation [48], gut motility involving activation of enteric neurons [49] and enhancement of Central Nervous System (CNS) functions [50]. HMO effects on cognitive function have been demonstrated in several preclinical models in the last decade [27,51-55]; clinical data are still limited with recent evidences of a positive association between 2´-FL human milk levels and cognitive development in infants at 24 months of age [56] and positive associations of relative abundance of fucosylated and sialylated HMOs with language at 18 months [57].
The present pilot study aimed to determine if maternal PBMI or diabetic status during pregnancy are linked to HMO profiles, specifically 2´-FL and 6´-SL concentrations, and whether those HMOs impact neurodevelopment in the offspring. To that end, we evaluated 2´-FL and 6´-SL levels in 1-month human milk samples in a secondary analysis of an existing cohort, a clinical trial called “Role of nutrition and maternal genetics on the programming of development of fetal adipose tissue” (PREOBE Study); in the PREOBE study overweight, obese and diabetic pregnant women and their offspring were compared to healthy, normal weight mothers and their offspring. Subsequently, to assess the role of 2´-FL and 6´-SL on infant neurodevelopment, 2´-FL and 6´-SL concentrations in human milk were compared with results from neurodevelopment assessments of infants born to mothers from the PREOBE study at different ages.
Materials and Methods
Clinical study design and milk sampling
The PREOBE study is a case control prospective cohort trial coordinated by the Department of Pediatrics of the School of Medicine at the University of Granada (Spain). The clinical study protocol was approved by the medical ethics committees of the Clinical University Hospital San Cecilio and the Mother-Infant University Hospital in Granada, Spain. All participants signed an informed consent at the beginning of the study. The trial was registered at www.ClinicalTrials. gov, identifier (NCT01634464).
The study design was previously published [58]. The PREOBE study was aimed to obtain genetic and biochemical biomarkers for the programming of obesity in the early stages of life. Some results derived from this clinical trial have been published [58-61]. The target population of this study consisted of 18 to 45 years old pregnant women between 12- and 34-weeks’ gestation. There were 4 study groups, reaching a final sample size of 331 subjects recruited: Healthy normal weight women (18.5 ≤ pBMI<25kg/m2; n=132), overweight women (25 ≤ pBMI<30 kg/m2; n = 56), obese women (pBMI ≥ 30kg/ m2; n=64), and women with GDM (pBMI ≥ 18.5 kg/m2; n=79). GDM group included both mothers who had already been diagnosed with GDM and mothers from normal weight, overweight and obese groups who developed GDM between recruitment and 34 weeks. The study flow chart is showed in Figure 1.
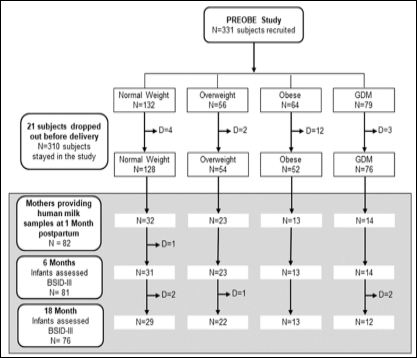
Figure 1: Study flow chart of the PREOBE study and follow-up of infant neurodevel- opment assessments. D: dropouts. During early infancy, reasons for dropout were loss of contact or non-attendance at the Bayley assessment visits.
Subjects who participated in other research studies, received pharmacological treatment, used drugs, were on a vegan diet, or suffered from the following diseases: pre-gestational diabetes, hypertension or preeclampsia, fetal intrauterine growth retardation, maternal infection during pregnancy, hypo/hyperthyroidism, hepatic or renal diseases were excluded from the study.
The present neurodevelopment follow-up of infants born to mothers from the PREOBE study was conducted up to 18 months of age; infants’ neurodevelopment was assessed at 6 and 18 months of age using the Bayley Scales of Infant Development, Third Edition (BSID- III). BSID-III has five domains: cognitive, language, motor, adaptive behavior and social-emotional development which are fully described in different publications [62,63]. The Bayley-III is appropriate for children between the ages of 1 month and 42 months. Generally, the evaluation of the adaptive and social-emotional domains is carried out using primary caregiver responses to a questionnaire.
Mothers were asked to collect human milk samples at 1 month postpartum (mature milk) in aliquots of 5 mL before and after each feed throughout 1 day, freeze aliquots at -20ºC and bring them to the site within 1 week. A small cooling box was given to mothers to transport milk samples to the site. Once at the site, samples were mixed and then stored at -80ºC and reserved for analysis.
UHPLC-MS/MS analysis
A total of 82 human milk samples collected at 1 month postpartum (mature milk) from the PREOBE study were analyzed by UHPLC- MS/MS as previously described [64] with some modifications. Briefly, human milk samples were thawed in a 37°C water bath for 10 minutes with smooth stirring to avoid separation of the fat fraction. A 25μL aliquot was placed in an Eppendorf tube with 500μl of MilliQ water, vortexed for 1 minute and filtered through Amicon 10K filters 30 minutes at 8°C and 14,000 rpm.
Chromatographic analysis was performed using a UHPLC BEH Amide column (2.1x100 mm, 1.7 μm particle size) from Waters. The flow rate was 300 μL/min. The column was maintained at 25ºC, the sample at 20ºC and the injection volume was 1 μL. A gradient mobile phase consisting of 0.1% (v/v) ammoniac aqueous solution (solvent A) and 0.1% (v/v) ammonia in acetonitrile (solvent B) was used. Gradient conditions were: 0.0-3.0 min, 10-25% A; 3.0-8.0 min, 25-40% A; 8.0-8.1 min 40-10% A; and 8.1-10.0 min 10% A to stabilize the initial conditions. The total run time was 8.1 min, and the post-delay time for reconditioning the column with 10% A was 1.9 min. Weak solvent was a mixture of 25 mL of water and 75 mL of acetonitrile, and strong solvent was a mixture of 80 mL of water and 20 mL of acetonitrile. The quantification standard curves were prepared with 2´-FL and 6´-SL external standards at concentrations of 0.015, 0.1, 0.5, 2, 10, and 20 mg/L. Oligosaccharide standards were purchased from Inalco (>95% purity). The test samples were quantified in the appropriate dilution by interpolating within the linear dynamic range of the calibration equation. The concentration levels were obtained by applying its dilution factor afterwards.
Statistical analysis
All statistical analyses were carried out using the R statistical software package for Windows (version 3.4). To compare continuous variables, analysis of variance (One-way ANOVA) was performed for normally distributed data and Kruskal-Wallis rank-sum test for non- normal variables; Chi-square test was used for proportions. Data was expressed as Mean ± Standard Deviation or frequencies depending on the outcome. Bonferroni or Dunn post hoc comparisons were used to identify significant pairwise group differences.
Pearson correlation and multivariate linear regression analyses were performed to assess the relationship between 2´-FL and 6´-SL concentrations and Bayley scales scores. Multivariate regression is defined by a β-coefficient being the degree of change in the outcome variable for every 1-unit of change in the predictor variable. Pearson correlation is defined by r coefficient that measures the strength and direction of association between two variables. Coefficient values may be negative or positive. To determine which confounding effects should be considered on the Bayley outcomes in the multivariate regression analyses, baseline or background factors were compared between the groups and those variables which were statistically different between groups were used as confounders.
Results
Demographic data, baseline and background characteristics
Demographic information, baseline conditions and other pertinent information obtained during the study period are shown in Table 1. As expected, a significant difference among groups in the pre- conceptional maternal weight and BMI was found with the lowest value for the normal weight group and the highest one for the obese group. Similar observations were found with maternal weight by the end of gestation (week 40). Groups were also different in Gestational Weight Gain (GWG): diabetic subjects reached an average of around 6 kg gained during pregnancy while normal weight subjects approximately doubled that value. Paternal IQ scores and maternal educational level were also different when comparing study groups. Regarding anthropometric infant variables at birth, waist circumference showed statistically significant differences with the highest average for infants born to obese mothers.
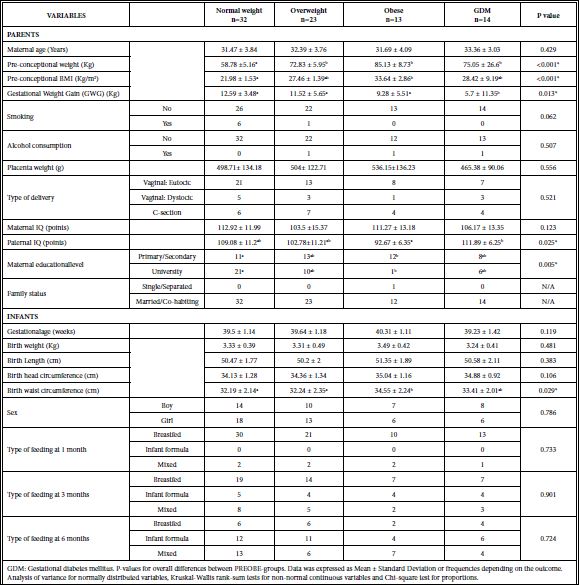
Table 1: Baseline and background characteristics of mother-child pairs who provided 1-month milk samples (n=82), including group comparisons among the four PREOBE-groups.
HMO concentrations in human milk
6´-SL concentrations: Content of 6´-SL in 1-month postpartum human milk samples was analyzed and results are shown in Table 2. No significant differences (p=0.641) were found when comparing the overall study groups.
2´-FL concentrations in human milk: 2’-FL is not present in all mother´s milk and its presence in human milk depends on the status of the mother regarding the secretor histo-blood group system: non-secretors typically lack 2’-FL among other α1-2 fucosylated oligosaccharides due to the absence of the pertinent enzyme [28]. In some studies secretor or non-secretor status was determined through serological tests, as mentioned in a systematic review recently published [65]; however, these tests were not included in this clinical trial protocol. Since we were able to detect 2´-FL in all milk samples we refer to subjects as mothers with low or high 2´-FL concentrations in their milk as opposed to non-secretor and secretor subjects. 2´- FL concentrations for the 82 mothers were graphically represented (Figure 2, Table 3). The graph showed a clear distribution of samples in two different groups depending on 2´-FL concentration: Low and High 2´-FL milk concentration groups. 2´-FL was detected in all milk samples. Out of a total of 82 mothers, 35 fell into the Low 2´- FL group and 47 mothers fell into the High 2´-FL group representing approximately 43% and 57% of total subjects, respectively.
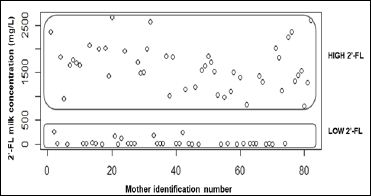
Figure 2: Distribution of subjects in Low 2´-FL and High 2´-FL milk concentration groups.
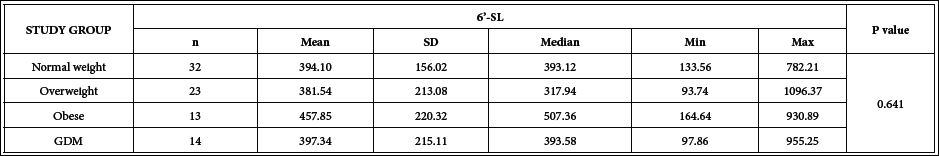
Table 2: 6´-SL Concentrations (mg/L) in 1-month postpartum human milk from mothers of the different groups participating in the PREOBE study.
n: number of cases; SD: Standard Deviation; Min: minimum; Max: maximum; P-value: level of significance.GDM: Gestational Diabetes Mellitus; Kruskal-Wallis rank sum test (non-parametric).
Content of 2´-FL in 1-month postpartum human milk samples is shown in Table 3. No significant differences were found comparing 2´-FL concentrations of the overall study groups (normal weight, overweight, obese and GDM) in the Low 2´-FL (p=0.092) or High 2´-FL sets (p=0.215) The study groups with low 2´-FL showed the median concentrations ranged between 3.89 to 10.2 mg/L in GDM and normal weight mothers respectively; high 2´-FL groups had median values ranging from 1153.03 mg/L to 1712.80 mg/L for GDM and normal weight groups respectively. For each 2´-FL concentration group, the lowest median values were those of GDM group and higher values were those for the normal weight group, but they were not statistically different.
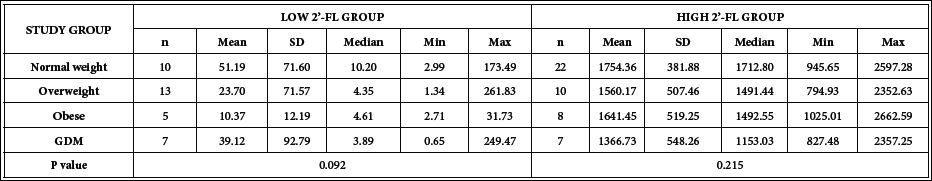
Table 3: 2´-FL Concentrations (mg/L) in 1-month postpartum human milk from mothers of the different groups participating in the PREOBE study.
n: number of cases; SD: Standard Deviation; Min: minimum; Max: maximum; GDM: Gestational Diabetes Mellitus; P-value: level of significance.Kruskal-Wallis rank sum test (non-parametric).
Neurodevelopment assessment: BSID-III
Of the 82 mothers that provided milk samples at 1 month postpartum, 81 consented to have their babies examined by BSDI-III at 6 months of age and 76 consented at 18 months of age.
Pregestational BMI or diabetic status did not influence 2´-FL or 6´-SL concentrations in mature milk. Therefore, we pooled the milk samples results of the 82 mothers from the different PREOBE study groups to determine if there was an association between 2´-FL and 6´-SL concentrations in human milk and BSID-III scores obtained in their infants at 6 and 18 months of age.
Unadjusted and adjusted multivariate regression analyses are shown in Tables 4 and 5. Statistical adjustment was carried out based on two different approaches: (1) possible confounders of GWG, paternal IQ and maternal educational level since those factors were significantly different between the PREOBE study groups (Table 1); (2) a similar baseline and background characteristics evaluation as shown in Table 1 was performed for High 2´-FL and Low 2´-FL groups and any significantly different variable was used as a confounder. Results from this last statistical analysis (data not shown) indicated that only maternal pre-conceptional weight was different between Low 2´-FL and High 2´-FL groups.
Regarding 6´-SL, a positive association (p=0.023) was observed between 6´-SL concentrations and composite cognitive scores at 18 months of age (See also correlation graph in Figure 3a) whilst a trend (p=0.082) was detected for 6´-SL concentrations and composite scores for motor skills at the same age (Table 4). In the multivariate regression adjusted for GWG, paternal IQ, maternal educational level and PREOBE study group, the positive association between 6´- SL concentrations and the cognitive scores at 18 months of age was maintained (p=0.041). For the second statistical approach in which maternal pre-conceptional weight and the PREOBE study groups were taken as confounders, a positive association between 6´-SL concentrations and composite cognitive scores at 18 months of age (p=0.019) was found as well as for 6´-SL concentration and composite motor scores at the same age (p=0.043) (Table 4).
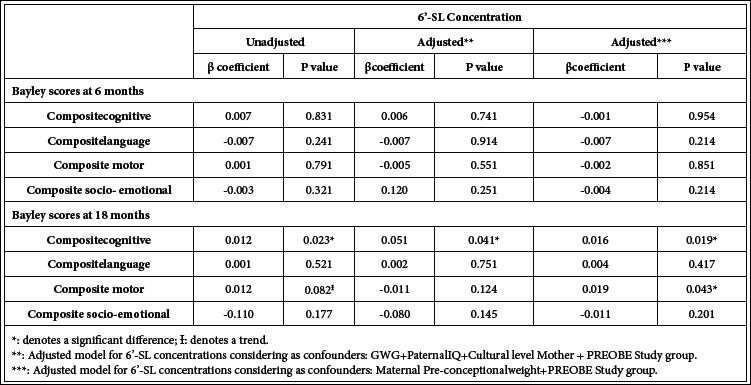
Table 4: Multivariate linear regression analysis for 6´-SL human milk concentration and the different Bayley scale scores at 6 and 18 months of age.
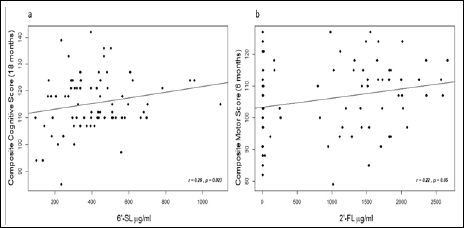
Figure 3: Pearson correlation graphs between 6´-SL concentrations and composite cognitive score at 18 months of age (a) and 2´-FLconcentration and composite motor score at 6 months of age (b).
As for 2´-FL, the unadjusted multivariate regression showed a trend (p=0.0502) for a positive association between 2´-FL concentration and motor scores at 6 months of age that reached significance (p=0.041) when adjusting for maternal pre-conceptional weight and PREOBE groups (Table 5 and correlation graph in Figure 3b). Similar multivariate regression analyses (unadjusted and adjusted) were also conducted considering 2´-FL levels for High 2´-FL and Low 2´-FL groups separately, however no significant results were obtained likely due to the low number of subjects in each group and/or to the influence of the subjects with low 2´-FL concentration (data not shown).
Discussion
In the present pilot study, mature human milk samples were analyzed from the PREOBE clinical study to evaluate the effects of maternal factors such as overweight/obesity and gestational diabetes on human milk concentrations of two abundant HMOs, 2´-FL and 6´- SL. Subsequently, we assessed the association between those human milk HMO concentrations and the BSDI-III scores obtained from infants born to mothers who provided respective milk samples. The results showed that 2´-FL and 6´-SL levels in human milk are not influenced by pre-gestational maternal weight or gestational diabetic status. In terms of infant neurodevelopment, a positive association was found between 6´-SL content in human milk and BSDI-III cognitive scale scores of human milk fed infants at 18 months of age; 2´-FL and 6´-SL milk concentrations were also positively associated with composite motor scores at 6 and 18 months of age, respectively.
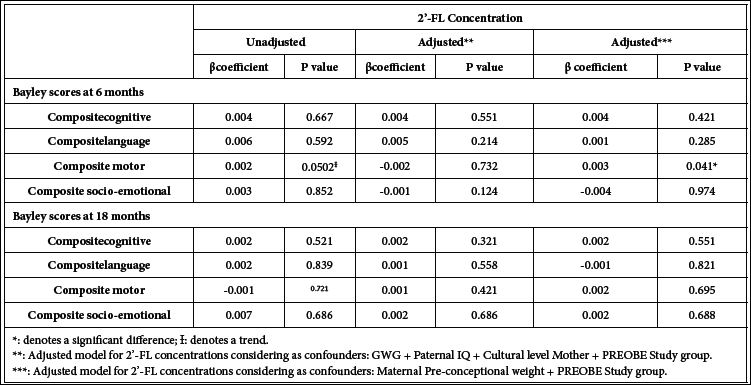
Table 5: Multivariate linear regression analysis for 2´-FL human milk concentration and the different Bayley scale scores at 6 and 18 months of age.
HMO composition of human milk is determined by genetics. Certain genes encode for enzymes involved in essential steps of HMO biosynthesis such as elongation, branching, fucosylation or sialylation and thereby, variation in enzyme expression among lactating mothers give rise to different HMO profiles in human milk. The impact of other maternal factors such as, diet, health status, age or medication intake on HMO synthesis in the human mammary gland remains mostly unknown [66].
In the case of pBMI and gestational diabetic status, a few studies evaluated the influence of these factors on HMO profiles. Smilowitz et al. analyzed milk samples collected at 2 weeks postpartum from 24 mothers that delivered at full term; 8 of those 24 mothers suffered from GDM. The results showed no difference in the absolute quantitation or relative percentage of HMO composition between milk from women with or without GDM [41]. Even though the current study focused on the concentration of 2 specific HMOs, 2´-FL and 6´-SL, as opposed to the total amount of HMOs measured in the Smilowitz´s work, our data also suggest GMD would not have a major impact on HMO profiles of human milk. Regarding maternal pBMI, Isganaitis et al. reported significant differences in 3 HMOs analyzed through untargeted LC–GC–MS in 1-month postpartum human milk samples from 35 mothers assigned to 2 different groups: those with a pBMI<25 (n=16, normal weight) or ≥ 25 kg/m2 (n=15, overweight/obese); 2´- FL, lacto-N-fucopentanose II/III and lacto-N-fucopentanose I levels were significantly associated with maternal pBMI after adjustment for potential confounders [9]. Those results differ from the data obtained for 2´-FL concentrations in our study where differences were not found among groups. The PREOBE study distinguished 3 different study groups in terms of pBMI, normal weight, overweight and obese subjects, while Isganaitis’ study included 2 pBMI ranges, normal weight and overweight/obese subjects. Noteworthy within the PREOBE study a statistical analysis was also conducted between normal and obese/ overweight subjects after pooling obese and overweight mothers into one group (pBMI ≥ 25 kg/m2) but a significant difference between groups was not found. In a recent cross-sectional, observational study [42], human milk samples from 17 to 76 days postpartum were analyzed for different HMOs and a positive correlation between pBMI and 2´-FL concentration was found in secretor mothers; however, this difference was not maintained when considering the mother’s Lewis phenotype and the number of subjects with overweight or obesity was not clearly stated in that work which makes it difficult to compare these results with the present study.
Clinical trials have been conducted to determine HMO effects on growth and tolerance in infants and to evaluate immune outcomes [43,67,68] however, cognitive outcomes have been scarcely evaluated in clinical studies to date. HMO effects on cognitive function have been reported in preclinical animal models. Different forms of sialic acid (Sia) supplementation, including 6´-SL, have been tested using piglet [69] and rodent models [27,52] showing a positive impact on cognitive performance. In some studies, supplementation with an exogenous source of Sia resulted in increased sialic acid in certain areas of the brain [51,52,69-73]. Fucosylated HMOs such as 2´-FL have also been evaluated in rodent cognition models. These studies demonstrated a role for 2′-FL in brain functionality, administered with the diet in adult animals [53,54] or through an oral supplementation during the lactation period in rat pups [55]. Regarding clinical data on HMO levels in human milk and cognitive development, a recent trial studied the relationship between the levels of nineteen HMOs in 1 and 6 months human milk samples and infant cognitive development at 24 months of age relative to maternal obesity and human milk feeding frequency [56]; results obtained show a positive association between 2´-FL human milk concentration at 1 month postpartum and cognitive function at 24 months of age using BSID-III. In the present study, an association between 2´-FL and 6´-SL human milk concentrations and infant cognitive function were also assessed using BSID-III but at earlier ages (6 and 18 months) than in the Berger study; moreover the results were evaluated considering different Bayley scales of infant development (cognitive, motor, language and socio-emotional scales) while in the Berger study analyses were limited to the cognitive scale.
In relation to the results obtained in the present study, a positive association between 6´-SL content in human milk and cognitive scale scores was found in infants assessed at 18 months of age. Cognitive scale in Bayley´s assessment consists of 91 items which evaluate children’s sensorimotor development, exploration and manipulation of objects, concept formation, and memory. Hence, infants complete tasks that measure their interest in novelty, attention to familiar and unfamiliar stimuli, and problem-solving [74]. These clinical observations align with preclinical research showing supplementation with 6´-SL during the lactation period in rat pups improved cognitive outcomes related to memory and long-term potentiation measurements at 1 year of age [27]. Additionally, data in the present study also suggest 6´-SL and 2´- FL concentrations may be associated with infants´ motor skills after adjusting for potential confounders. Nevertheless, 2´-FL association with motor scores was not significant when samples were separated into low and high 2´-FL levels, probably due to the low number of subjects in each group and/or to the influence of the mother-infant pairs with low 2´-FL concentration.
Aside from the confounders considered in the statistical analysis of the present study, children’s health is determined by the interaction of biological, behavioral, and environmental (physical and social) influences that may also influence child neurodevelopment and thereby, the scores obtained in Bayley´s assessment [75].
Although BSID-III was initially designed as a diagnostic instrument to identify suspected developmental delays in children identified with possible disorders and disabilities [76], in the last decade it has been widely used to assess the developmental functioning of healthy children without developmental disorders, as is the case in the present study. A potential relationship between cognitive outcomes and 6´- SL levels was detected even though children evaluated did not suffer from a developmental disorder. However, it may also explain why a significant association was not detected between 2´-FL concentration and Bayley cognitive scale score: slight differences in behavior in children without disabilities may have been undetected.
One of the limitations of the present study is the low number of mother-infant pairs evaluated due to the reduced number of human milk samples available. Consequently, the pilot nature of this work should be noted; nevertheless, it may be useful as a starting point to calculate the size of future large-scale trials aiming to determine the influence of HMOs on Bayley III scores.
The mechanism(s) of action by which HMOs exert their cognitive effects remains unclear although hypotheses have been proposed. The improved cognitive performance derived from HMO supplementation in different preclinical models may be related to its prebiotic function due to metabolites that reach the brain producing structural changes responsible for enhanced cognitive skills. Preclinical research showed administration of an exogenous source of sialylated compounds increased the sialic acid concentration of key areas of the brain [51,52,69-73] suggesting sialic acid reached the brain; it is unlikely that intact 2′-FL goes to the brain directly [77] but may act via the Gut-Brain Axis (GBA) and through the vagus nerve [54]. GBA is a complex bidirectional network that sends signals between these two organs controlling their function [78]. Microbiota may also have an important role in the interaction [79,80], but this remains unclear. Interestingly, a recent study derived from the PREOBE study has shown an association between gut microbiota and infant cognitive performance at 6 months of age [81].
In summary, in this preliminary study 6´-SL and 2´-FL levels were not impacted by pBMI or the development of GDM. 6´-SL level in human milk was associated with infant neurodevelopment. 2´-FL concentrations were associated with motor scores at 6 months of age when considering Low and High 2´-FL milk samples together; this association was lost when Low and High 2´-FL groups were treated separately. Further research and full-scale clinical studies are needed to elucidate the effects of HMOs in pediatric neurodevelopment as well as the mechanism(s) of action involved and the influence of Low and High 2´-FL populations.
Acknowledgments
The results described in this manuscript are part of the doctoral thesis project of E.O. within the doctoral program in Biomedicine of the University of Granada. The authors would like to thank also the technical staff for their assistance.
Author Contributions
Investigation, E.O., C.C., and M.J.M.; Present methodology, E.O., C.C. and M.J.M; Coordinator of the PREOBE study, C.C.; Present Supervision, C.C. and M.J.M.; HMO analysis, A.S. Mothers’ milk recruitment and storage, F.J.T.E. and M.T.S.; PREOBE follow- up: F.J.T.E., M.T.S. and M.E.; Neuropsychological assessment and interpretation: F.J.T.E and A.C.; Statistical analysis, H.A.; Writing, original draft, E.O. Writing, review and editing, C.C., R.B., M.R, R.R. and M.J.M.
Conflicts of Interest
E.O., R.B., M.R., A.S., R.R. and M.J.M. are employees of Abbott Laboratories, a company that manufactures infant formulas. C.C., F.J.T.E., M.T.S., M.E., A.C. and H.A., have no conflicts of interest to declare.
Funding
PREOBE study was funded by Spanish Ministry of Innovation and Science. Junta de Andalucía: Excellence Projects (P06-CTS-02341). The present research received no external funding.
References
- Bauer J, Gerss J (2011) Longitudinal analysis of macronutrients and minerals in human milk produced by mothers of preterm infants. Clin Nutr 30: 215-220.
- Ballard O, Morrow AL (2013) Human milk composition: Nutrients and bioactive factors. Pediatr Clin North Am 60: 49-74.
- (US) Children’s Health, The Nation’s Wealth: Assessing and Improving Child Health. The National Academies Collection: Reports funded by National Institutes of Health. Washington (DC) 2004.
- Bachour P, Yafawi R, Jaber F, Choueiri E, Abdel-Razzak Z (2012) Effects of smoking, mother’s age, body mass index, and parity num- ber on lipid, protein, and secretory immunoglobulin: A concentra- tions of human milk. Breastfeed Med 7 :179-188.
- Lonnerdal B (1986) Effects of maternal dietary intake on human milk composition. J Nutr 116: 499-513.
- Panagos P, Matthan N, Sen S (2014) Effects of maternal obesity on breastmilk composition and infant growth (247.7). The FASEB Journal 28.
- De Luca A, Frasquet-Darrieux M, Gaud MA, Christin P, Boquien CY, et al. (2016) Higher Leptin but Not Human Milk Macronutrient Concentration Distinguishes Normal-Weight from Obese Mothers at 1-Month Postpartum. PLoS One 11: e0168568.
- Panagos PG, Vishwanathan R, Penfield-Cyr A, Matthan NR, Shivappa N, et (2016) Breastmilk from obese mothers has pro-inflammatory properties and decreased neuroprotective factors. J Perinatol 36: 284-290.
- Isganaitis E, Venditti S, Matthews TJ, Lerin C, Demerath EW, et (2019) Maternal obesity and the human milk metabolome: Associa- tions with infant body composition and postnatal weight gain. Am J Clin Nutr 110: 111-120.
- Fujimori M, Franca EL, Fiorin V, Morais TC, Honorio-Franca AC, et (2015) Changes in the biochemical and immunological compo- nents of serum and colostrum of overweight and obese mothers. BMC Pregnancy Childbirth 15: 166.
- Garcia-Ravelo S, Diaz-Gomez NM, Martin MV, Dorta-Guerra R, Murray M, et al. (2018) Fatty Acid Composition and Eicosanoid Levels (LTE4 and PGE2) of Human Milk from Normal Weight and Overweight Mothers. Breastfeed Med 13: 702-710.
- Makela J, Linderborg K, Niinikoski H, Yang B, Lagstrom H (2013) Breast milk fatty acid composition differs between overweight and normal weight women: The STEPS Study. Eur J Nutr 52: 727-735.
- Rudolph MC, Young BE, Lemas DJ, Palmer CE, Hernandez TL, et (2017) Early infant adipose deposition is positively associated with the n-6 to n-3 fatty acid ratio in human milk independent of maternal BMI. Int J Obes (Lond) 41: 510-517.
- Young BE, Patinkin Z, Palmer C, De la Houssaye B, Barbour LA, et (2017) Human milk insulin is related to maternal plasma insulin and BMI: But other components of human milk do not differ by BMI. Eur J Clin Nutr 71:1094-1100.
- Chan D, Goruk S, Becker AB, Subbarao P, Mandhane PJ, et al. (2018) Adiponectin, leptin and insulin in breast milk: Associations with maternal characteristics and infant body composition in the first year of life. Int J Obes (Lond) 42: 36-43.
- Fields DA, Demerath EW (2012) Relationship of insulin, glucose, leptin, IL-6 and TNF-alpha in human breast milk with infant growth and body composition. Pediatr Obes 7: 304-12.
- Fields DA, George B, Williams M, Whitaker K, Allison DB, et al. (2017) Associations between human breast milk hormones and ad- ipocytokines and infant growth and body composition in the first 6 months of life. Pediatr Obes 12: 78-85.
- Cabrera-Rubio R, Collado MC, Laitinen K, Salminen S, Isolauri E, et al. (2012) The human milk microbiome changes over lactation and is shaped by maternal weight and mode of delivery. Am J Clin Nutr 96: 544-551.
- Garcia-Mantrana I, Collado MC (2016) Obesity and overweight: Im- pact on maternal and milk microbiome and their role for infant health and nutrition. Mol Nutr Food Res 60: 1865-1875.
- Gomez-Gallego C, Garcia-Mantrana I, Salminen S, Collado MC (2016) The human milk microbiome and factors influencing its com- position and activity. Semin Fetal Neonatal Med 21: 400-405.
- Bitman J, Hamosh M, Hamosh P, Lutes V, Neville MC, et al. (1989) Milk composition and volume during the onset of lactation in a dia- betic mother. Am J Clin Nutr 50: 1364-1369.
- Coppa GV, Gabrielli O, Pierani P, Catassi C, Carlucci A, et (1993) Changes in carbohydrate composition in human milk over 4 months of lactation. Pediatrics 91: 637-641.
- Thurl S, Munzert M, Henker J, Boehm G, Muller-Werner B, et al. (2010) Variation of human milk oligosaccharides in relation to milk groups and lactational periods. Br J Nutr 104: 1261-271.
- Xu G, Davis JC, Goonatilleke E, Smilowitz JT, German JB, et al. (2017) Absolute Quantitation of Human Milk Oligosaccharides Re- veals Phenotypic Variations during Lactation. J Nutr 147: 117-124.
- Austin S, De Castro CA, Sprenger N, Binia A, Affolter M, et al. (2019) Human Milk Oligosaccharides in the Milk of Mothers Deliver- ing Term versus Preterm Infants. Nutrients 11: 1282.
- Reverri EJ, Devitt AA, Kajzer JA, Baggs GE, Borschel MW (2018) Review of the Clinical Experiences of Feeding Infants Formula Con- taining the Human Milk Oligosaccharide 2’-Fucosyllactose. Nutri- ents 10: 1346.
- Oliveros E, Vazquez E, Barranco A, Ramirez M, et (2018) Sialic Acid and Sialylated Oligosaccharide Supplementation during Lac- tation Improves Learning and Memory in Rats. Nutrients 10: 1519.
- Castanys-Munoz E, Martin MJ, Prieto PA (2013) 2’-fucosyllactose: An abundant, genetically determined soluble glycan present in hu- man milk. Nutr Rev 71 : 773-789.
- Hong Q, Ruhaak LR, Totten SM, Smilowitz JT, German JB, et al. (2014) Label-free absolute quantitation of oligosaccharides using multiple reaction monitoring. Anal Chem 86: 2640-2647.
- Van Niekerk E, Autran CA, Nel DG, Kirsten GF, Blaauw R, et al. (2014) Human milk oligosaccharides differ between HIV-infected and HIV-uninfected mothers and are related to necrotizing entero- colitis incidence in their preterm very-low-birth-weight J Nutr 144: 1227-1233.
- Totten SM, Zivkovic AM, Wu S, Ngyuen U, Freeman SL, et (2012) Comprehensive profiles of human milk oligosaccharides yield highly sensitive and specific markers for determining secretor status in lac- tating mothers. J Proteome Res 11: 6124-6133.
- Sprenger N, Odenwald H, Kukkonen AK, Kuitunen M, Savilahti E, et (2017) FUT2-dependent breast milk oligosaccharides and aller- gy at 2 and 5 years of age in infants with high hereditary allergy risk. Eur J Nutr 56: 1293-1301.
- Austin S, De Castro CA, Benet T, Hou Y, Sun H, et (2016) Tem- poral Change of the Content of 10 Oligosaccharides in the Milk of Chinese Urban Mothers. Nutrients 8: 346.
- Ten Bruggencate SJ, Bovee-Oudenhoven IM, Feitsma AL, Van Hof- fen E, Schoterman MH (2014) Functional role and mechanisms of sialyllactose and other sialylated milk oligosaccharides. Nutr Rev 72: 377-389.
- Erney RM, Malone WT, Skelding MB, Marcon AA, Kleman-Leyer KM, et (2000) Variability of human milk neutral oligosaccharides in a diverse population. J Pediatr Gastroenterol Nutr 30: 181-192.
- Coppa GV, Pierani P, Zampini L, Carloni I, Carlucci A, et (1999) Oligosaccharides in human milk during different phases of lactation. Acta Paediatr Suppl 88: 89-94.
- Kunz C, Meyer C, Collado MC, Geiger L, Garcia-Mantrana I, et al. (2017) Influence of Gestational Age, Secretor, and Lewis Blood Group Status on the Oligosaccharide Content of Human J Pe- diatr Gastroenterol Nutr 64: 789-798.
- McGuire MK, Meehan CL, McGuire MA, Williams JE, Foster J, et (2017) What’s normal? Oligosaccharide concentrations and profiles in milk produced by healthy women vary geographically. Am J Clin Nutr 105:1086-1100.
- Tonon KM, Miranda A, Abrao A, De Morais MB, et al. (2019) Vali- dation and application of a method for the simultaneous absolute quantification of 16 neutral and acidic human milk oligosaccharides by graphitized carbon liquid chromatography- electrospray ioniza- tion- mass spectrometry. Food Chem 274: 691-697.
- Azad MB, Robertson B, Atakora F, Becker AB, Subbarao P, et al. (2018) Human Milk Oligosaccharide Concentrations Are Associated with Multiple Fixed and Modifiable Maternal Characteristics, Envi- ronmental Factors, and Feeding Practices. J Nutr 148: 1733-1742.
- Smilowitz JT, Totten SM, Huang J, Grapov D, Durham HA, et al. (2013) Human milk secretory immunoglobulin a and lactoferrin N-glycans are altered in women with gestational diabetes mellitus. J Nutr 143: 1906-1912.
- Tonon KM, De Morais MB, Abrao ACFV, Miranda AMTB (2019) Ma- ternal and Infant Factors Associated with Human Milk Oligosaccha- rides Concentrations According to Secretor and Lewis Nutrients 11: 1358.
- Goehring KC, Marriage BJ, Oliver JS, Wilder JA, Barrett EG,et al. (2016) Similar to Those Who Are Breastfed, Infants Fed a Formula Containing 2’-Fucosyllactose Have Lower Inflammatory Cytokines in a Randomized Controlled Trial. J Nutr 146: 2559-2566.
- Donovan SM, Comstock SS (2016) Human Milk Oligosaccharides Influence Neonatal Mucosal and Systemic Ann Nutr Me- tab 69: 42-51.
- Weichert S, Koromyslova A, Singh BK, Hansman S, Jennewein S, et (2016) Structural Basis for Norovirus Inhibition by Human Milk Oligosaccharides. J Virol 90: 4843-4848.
- Weichert S, Jennewein S, Hufner E, Weiss C, Borkowski J, et al. (2013) Bioengineered 2’-fucosyllactose and 3-fucosyllactose inhibit the adhesion of Pseudomonas aeruginosa and enteric pathogens to human intestinal and respiratory cell Nutr Res 33: 831-838.
- Jost T, Lacroix C, Braegger C, Chassard C (2015) Impact of human milk bacteria and oligosaccharides on neonatal gut microbiota es- tablishment and gut health. Nutr Rev 73: 426-437.
- He Y, Liu S, Kling DE, Leone S, Lawlor NT, et (2016) The human milk oligosaccharide 2’-fucosyllactose modulates CD14 expression in human enterocytes, thereby attenuating LPS-induced inflamma- tion. Gut 65: 33-46.
- Bienenstock J, Buck RH, Linke H, Forsythe P, Stanisz AM,et al. (2013) Fucosylated but not sialylated milk oligosaccharides dimin- ish colon motor contractions. PLoS One 8: e76236.
- Nakano T, Sugawara M, Kawakami H (2001) Sialic acid in human milk: Composition and functions. Acta Paediatr Taiwan 42: 11-17.
- Wang B, Downing JA, Petocz P, Brand-Miller J, Bryden WL (2007) Metabolic fate of intravenously administered N-acetylneuraminic acid-6-14C in newborn piglets. Asia Pac J Clin Nutr 16: 110-115.
- Morgan BL, Winick M (1980) Effects of administration of N-acetyl- neuraminic acid (NANA) on brain NANA content and behavior. J Nutr 110: 416-424.
- Vazquez E, Barranco A, Ramirez M, Gruart A, Delgado-Garcia JM, et (2015) Effects of a human milk oligosaccharide, 2’-fucosyllac- tose, on hippocampal long-term potentiation and learning capabili- ties in rodents. J Nutr Biochem 26: 455-465.
- Vazquez E, Barranco A, Ramirez M, Gruart A, Delgado-Garcia JM, et al. (2016) Dietary 2’-Fucosyllactose Enhances Operant Condi- tioning and Long-Term Potentiation via Gut-Brain Communication through the Vagus Nerve in Rodents. PLoS One 11: e0166070.
- Oliveros E, Ramirez M, Vazquez E, Barranco A, Gruart A, et al. (2016) Oral supplementation of 2’-fucosyllactose during lactation improves memory and learning in rats. J Nutr Biochem 31: 20-27.
- Berger PK, Plows JF, Jones RB, Alderete TL, Yonemitsu C, et al. (2020) Human milk oligosaccharide 2’-fucosyllactose links feedings at 1 month to cognitive development at 24 months in infants of nor- mal and overweight mothers. PLoS One 15: e0228323.
- Jorgensen JM, Young R, Ashorn P, Ashorn U, Chaima D, et al. (2020) Associations of human milk oligosaccharides and bioac- tive proteins with infant growth and development among Malawian mother-infant dyads. Am J Clin Nutr 1-12.
- Berglund SK, Garcia-Valdes L, Torres-Espinola FJ, Segura MT, Martinez-Zaldivar C, et (2016) Maternal, fetal and perinatal alter- ations associated with obesity, overweight and gestational diabetes: An observational cohort study (PREOBE). BMC Public Health 16: 207.
- Torres-Espinola FJ, Berglund SK, Garcia-Valdes LM, Segura MT, (2015) Maternal Obesity, Overweight and Gestational Diabetes Af- fect the Offspring Neurodevelopment at 6 and 18 Months of Age--A Follow Up from the PREOBE Cohort. PLoS One 10: e0133010.
- De la Garza Puentes A, Montes Goyanes R, Chisaguano Tonato AM, Torres-Espinola FJ, Arias Garcia M, et (2017) Association of maternal weight with FADS and ELOVL genetic variants and fatty acid levels-The PREOBE follow-up. PLoS One 12: e0179135.
- Torres-Espinola FJ, Berglund SK, Garcia S, Perez-Garcia M, Cat- ena A, et al. (2018) Visual evoked potentials in offspring born to mothers with overweight, obesity and gestational diabetes. PLoS One 13: e0203754.
- Albers CA, Grieve AJ (2007) Test Review: Bayley, N. (2006). Bay- ley Scales of Infant and Toddler Development-Third Edition. San Antonio, TX: Harcourt Assessment. Journal of Psychoeducational Assessment 25: 180-190.
- Bayley N (2006) Bayley Scales of Infant and Toddler Development, 3rd edn: San Antonio: TX: Harcourt Assessment.
- Santos-Fandila A, Zafra-Gomez A, Vazquez E, Navalon A, Rueda R, et al. (2014) Ultra high performance liquid chromatography-tan- dem mass spectrometry method for the determination of soluble milk glycans in rat serum. Talanta 118: 137-146.
- Thurl S, Munzert M, Boehm G, Matthews C, Stahl B (2017) System- atic review of the concentrations of oligosaccharides in human Nutr Rev 75: 920-933.
- Bode L (2015) The functional biology of human milk oligosaccha-rides. Early Hum Dev 91L: 619-622.
- Marriage BJ, Buck RH, Goehring KC, Oliver JS, Williams JA (2015) Infants Fed a Lower Calorie Formula With 2’FL Show Growth and 2’FL Uptake Like Breast-Fed Infants. J Pediatr Gastroenterol Nutr 61: 649-658.
- Puccio G, Alliet P, Cajozzo C, Janssens E, Corsello G, et (2017) Effects of Infant Formula With Human Milk Oligosaccharides on Growth and Morbidity: A Randomized Multicenter Trial. J Pediatr Gastroenterol Nutr 64: 624-631.
- Wang B, Yu B, Karim M, Hu H, Sun Y, et al. (2007) Dietary sialic acid supplementation improves learning and memory in Am J Clin Nutr 85: 561-569.
- Jacobi SK, Yatsunenko T, Li D, Dasgupta S, Yu RK, et (2016) Di- etary Isomers of Sialyllactose Increase Ganglioside Sialic Acid Con- centrations in the Corpus Callosum and Cerebellum and Modulate the Colonic Microbiota of Formula-Fed Piglets. J Nutr 146: 200-208.
- Mudd AT, Fleming SA, Labhart B, Chichlowski M, Berg BM, et al. (2017) Dietary Sialyllactose Influences Sialic Acid Concentrations in the Prefrontal Cortex and Magnetic Resonance Imaging Measures in Corpus Callosum of Young Pigs. Nutrients 9: 1297.
- Carlson SE, House SG (1986) Oral and intraperitoneal administra- tion of N-acetylneuraminic acid: Effect on rat cerebral and cerebel- lar N-acetylneuraminic acid. J Nutr 116: 881.
- Scholtz SA, Gottipati BS, Gajewski BJ, Carlson SE (2013) Dietary sialic acid and cholesterol influence cortical composition in develop- ing rats. J Nutr 143: 132-135.
- Piñon M (2010) Theoretical Background and Structure of the Bayley Scales of Infant and Toddler Development, Third In: Weiss LGO, T.; Aylward, G.P., editor. Bayley-III Clinical Use and Interpre- tation. San Diego: Academic Press 1-28.
- National Research C, Institute of M. The National Academies Collection: Reports funded by National Institutes of Health. Chil- dren’s Health, The Nation’s Wealth: Assessing and Improving Child Washington (DC): National Academies Press (US). Copy- right © 2004, National Academy of Sciences.; 2004.
- Armstrong KHA, H.C. (2010) The Bayley-III Cognitive Scale. In: Weiss LGO, ; Aylward, G.P., editor. Bayley-III Clinical Use and In- terpretation. San Diego: Academic Press: 29-45.
- Kuntz S, Kunz C, Borsch C, Vazquez E, Buck R, et al. (2019) Metabolic Fate and Distribution of 2 -Fucosyllactose: Direct Influ- ence on Gut Microbial Activity but not on Mol Nutr Food Res e1900035.
- Carabotti M, Scirocco A, Maselli MA, Severi C (2015) The gut-brain axis: interactions between enteric microbiota, central and enteric nervous systems. Ann Gastroentero 28: 203-209.
- Marques TM, Cryan JF, Shanahan F, Fitzgerald GF, Ross RP, et (2014) Gut microbiota modulation and implications for host health: Dietary strategies to influence the gut-brain axis. Innovative Food Science & Emerging Technologies 22: 239-247.
- Cerdó T, García-Valdés L, Altmäe S, Ruíz A, Suárez A, et (2016) Role of microbiota function during early life on child’s neurodevelop- ment. Trends in Food Science & Technology 57: 273-288.
- Cerdo TRA, Acuna I, Torres-Espínola FJ, Jáuregui R, Suárez A, et al. (2019) Gut microbiota is associated with the infant cognitive development. ESPGHAN Annual Meeting; Glasgow, Scotland, UK.
Citation: Oliveros E, Martín MJ, Torres-Espínola FJ, Segura-Moreno MT, Ramírez M, et al. (2021) Human Milk Levels of 2´-Fucosyllactose and 6´-Sialyllactose are Positively Associated with Infant Neurodevelopment and are Not Impacted by Maternal BMI or Diabetic Status.J Nutr Food Sci 4: 024.
Copyright: © 2021 Oliveros E, et al. This is an open-access article distributed under the terms of the Creative Commons Attribution License, which permits unrestricted use, distribution, and re- production in any medium, provided the original author and source are credited.