*Corresponding Author:
Robert Mutagwanya,
School of Food Technology, Nutrition and Bioengineering, Makerere University, Uganda
Tel: +256392944426/+256701245160
E-mail: robertmutagwanya@gmail.com
Abstract
Background: Consumption of a varied diet reduces the risk of developing a deficiency or excess of any one nutrient.One of the three corner stones of diabetes management is diet and therefore, dietary diversity is key among diabetes patients.
Objective: The objective of this study was to establish the impact of nutrition education on the Dietary Diversity Scores (DDS) among type 2 diabetes patients.
Methods: Kant et al method was used for scoring dietary diversity. Data were analyzed using the Statistical Package for Social Sciences (SPSS version 21). Pair sample t-test was used to compare total DDS after and before nutrition education. P<0.05 was considered as statistically significant.
Subjects: One hundred type 2 diabetic patients were randomly selected and divided into two groups of intervention and control (50 patients in each group) to participate in the study. Data were collected using a pre-tested questionnaire before and after intervention every after one month for a period of four months of intervention.
Results: The average age of patients who participated in the study was 48 (40-51) years. Most of the patients were females (65.39%), compared to males (34.01%). At the end of the study period of four months, DDS in the control group decreased from 40.08% to 38.49% (p=0.064) while in the intervention group, DDS increased from 35.30% to 54.20% (p<0.001).
Conclusion: Dietary diversity increased after nutrition education among type 2 diabetes patients.
Keywords
Dietary assessment; Dietary diversity score; Nutrition education; Type 2 diabetes
Introduction
Diabetes is a major problem of public health concern, long-term condition with a major impact on socioeconomic development of individuals, families and societies worldwide. The global diabetes prevalence in 2019 was nearly half a billion people (463 million adult people aged 20-79 years) accounting for 9.3%, estimated to rise to 10.2% (578 million) by 2030 and 10.9% (700 million) by 2045 [1]. Diabetes is reported as among the top 10 causes of global death in adults, and was estimated to have caused four million deaths in 2017. In 2017, global health expenditure on diabetes was estimated to be USD 727 billion. Over the past three decades, there has been a steady increase in the prevalence of diabetes globally but with rapid increase evidenced in low- and middle-income countries. According to [2], it is estimated that about 80% of all new incidence of diabetes will occur in developing countries by 2025. In 2019, there were estimated to be around 592 million deaths among those aged 60 years and younger due to diabetes in South East Asia. South America and Central America had the lowest number of diabetes-related deaths that year [3]. The increase in the prevalence of diabetes is associated with factors such as population overgrowth, urbanization, aging, physical inactivity, and obesity. On the other hand, diabetes coexists with many risk factors related to Cardiovascular Diseases (CVD) and other metabolic syndromes. This therefore, calls for proper management and diagnosis of related diseases. Dietary management of diabetes mellitus is one of the pillars that has been widely in the Ugandan health care centers and hospitals. Food choices among diabetes patients is of great concern as it has impact on Body Mass Index (BMI) which is a potential risk indicator of type 2 diabetes mellitus. According to Uganda Demographic and Health Survey (UDHS) of 2016, it was reported that 9% of adult males and 24% adult women were overweight or obese (BMI ≥ 25) [4]. Therefore, controlling BMI is one of the key measures for glycemic control among patients with type 2 diabetes mellitus. In order to maintain normal weight, consumption of diverse food stuffs and servings in all food groups is recommended [5]. On the other hand, the quality of the diet consumed by diabetes patients is crucial. Therefore, assessing the diet quality of individuals with diabetes is beneficial for the development of an effective diabetes management intervention, which entails a proper evaluation of their dietary status, particularly for secondary and tertiary prevention to decelerate the worsening of various diabetic complications. To assess the quality of a diet, Dietary Diversity Scores (DDS) are used. To assess the DDS according to US Department of Agriculture’s food guide pyramid, five main groups, including grains, vegetables, fruits, meat, and meat substitutes and dairy products are used, and each of these five groups is divided into several subgroups [6]. In several studies that have been conducted, it is reported that better dietary status showed a remarkable range in protective effects towards health outcomes of diabetes patients. Therefore, this study aimed to assess the effect of nutrition education on dietary diversity scores among type 2 diabetes patients.
Methodology
Design and subjects
A longitudinal cohort non blinded intervention study was conducted from March 2012 to July 2012. In this study, 100 type 2 diabetes out-patients were randomly selected and divided into two groups of intervention and control (50 patients in each group). To control potential confounding factors, the two groups were matched i.e. patients with very similar physiological status were included in the study. Although, only 34 and 18 of the 50 patients in the intervention and control group respectively completed the study (Figure 1). Most of the patients were doing seasonal businesses and could not afford to stay near the hospital while others in the intervention group after getting better, they went back to the villages. Inclusion criteria included; having type 2 diabetes, aged at least 18 years, attending the diabetic clinic, able and willing to perform physical activity for atleast 30 minutes daily during the study period. Those excluded from the study included; very ill type 2 diabetes patients, type 1 diabetes patients, type 2 diabetes patients who were not willing to perform physical activity, and all pregnant diabetic patients. Those patients who were not willing to participate or continue the study were also excluded. The intervention group received nutrition education geared towards promoting dietary diversity, change in the feeding practices, health lifestyle like physical activity, abstinence from alcohol and smoking in addition to the usual care (medication and some rudimental teaching about the dos and don’ts of diabetes) that was provided in the diabetes clinic. This was based on the nutritional recommendations of the world health organization and American Diabetes Association (ADA) [7]. The intervention group received 2 diabetes nutrition education sessions each 30 minutes a day twice a week. The health belief model by Hochbaum et al. (1950) ,which hypothesizes that health-related action depends on sufficient motivation (benefits) to make health issue relevant to consumer was used during nutrition education to promote consumption of a diverse food group diet consisting of Cereals; Vitamin A rich vegetables and tubers; White roots and tubers; Dark green leafy vegetables; Other vegetables; Vitamin A rich fruits; Other fruits; Organ meat; Flesh meat; Eggs; Fish; Legumes, nuts and seeds; Milk and milk productsbut with observance of non-health oils and fats. The study involved use of various learning objectives. The learning materials included a conversation map for type 2 diabetics, various food samples, food preparation video compact discs, kitchen ware.
Sample size calculation
The statistical equation by Dell (2002) was modified and used to calculate the number of patients who were recruited in the study.

(Se2- Sc2)2
Where:
n=sample size for each group
Zα=Z-value for type I error (e.g.1.96 at 5% level) Zβ=Z-value for type II error (e.g. 0.84 at 20% level)
Se=Variance estimate of outcome for intervention group receiving nu- trition education to promote dietary diversity in addition to the usual care given in the endocrine unit.
Sc=Variance estimate of outcome for control group having only the usual care given in the endocrine unit without the nutrition education promoting dietary diversity.
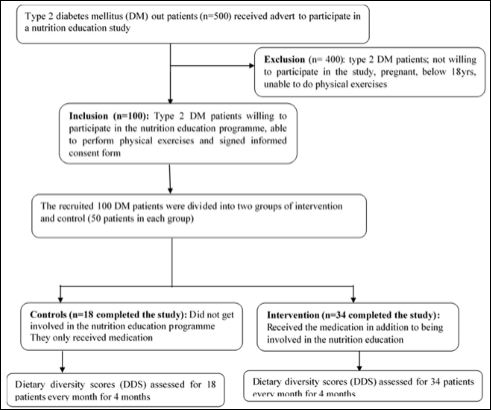
Figure 1: Flow chart of participants that participated in cohort study.
A similar study called “Diet or diet plus physical activity versus usual care in
Patients with newly diagnosed type 2 diabetes: The Early AC- TID randomized controlled trial” was used to get the values of Se of HbA1C equal to 1 and Sc of HbA1C equal to 1.02 (Andrews, 2011).
Values of HbA1C in the above study were used to calculate the sample size as below.

(-0.0404)2
That is n= 50 participants
Data collection
Demographic characteristics of type 2 diabetes patients; gender, age, education, marital status having risk factors of diabetes (smoking, type 2 diabetes mellitus), having a history of diabetes among family members, were completed in a pre-tested questionnaire form. Weight was measured using digital scale with accuracy nearest to 0.1 kg and minimal clothes. Height was also measured by a stadiometer with
0.1 cm accuracy. BMI was calculated by dividing weight (kg) by the square of height (m). These measurements were conducted two times for those who were able to complete the study; once before and once after the intervention period. The intervention group received nutrition education geared towards promoting dietary diversity, change in the feeding practices, health lifestyle like physical activity, abstinence from alcohol and smoking in addition to the usual care that was provided in the diabetes clinic. This was based on the nutritional recommendations of the world health organization and American Diabetes Association (ADA). The intervention consisted of two educational sessions each 30 minutes every week. The IDDS was conducted according to the method described by [8,9] with some modifications. The DDS of an individual was got by counting number of food groups consumed by an individual divided by 14 and a percentage computed [10]. A Saturday was chosen by consensus because that was the day when patients were to be free and therefore do correct recording of the foods eaten. Mean values of DDS were calculated by adding each individual’s DDS divided by total number of patients in the group. Patients were asked similar questions many times to check for consistency Abrupt community visits were performed to check the filling of dietary diversity score sheets versus real food eaten and following of recommended lifestyle.
Statistical analyses
Data were analyzed using SPSS (version 21). Student’s t test was used to compare the values between the two groups before and after intervention. The mean differences of variables were compared by paired t-test and p-values less than 0.05 were considered significant.
Results
Social demographic characteristics and some risk factors of type 2 diabetes patients in the intervention and control
Table 1 shows results of socio-demographic characteristics some risk factors of type 2 diabetic patients attending the Diabetes Clinic of the Endocrine Unit, Mulago Hospital who participated in the study. The average age of patients was 48 years. Most of the patients were females (65.39%), compared to males (34.01%). On average, 22.88% of the patients were married. Findings also showed that 48.37% of patients were self-employed while only 8.50% were unemployed. In addition, 28.60% of patients had tertiary education while 4.25% had pre-primary education. The family history of diabetes was positive in 19.44% of the patients. The majority of patients were non-smokers (94.45%) while smokers were 5.56% Table 2.
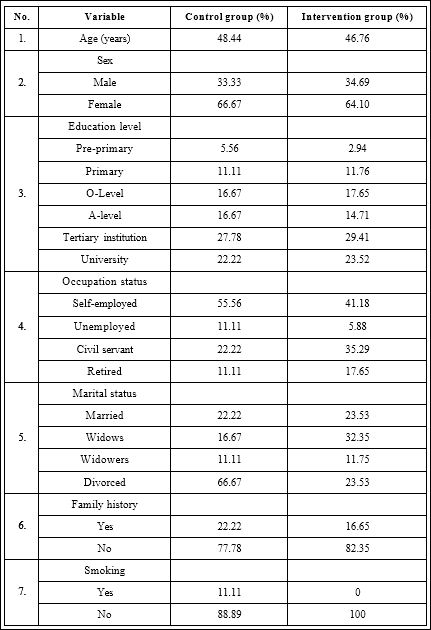
Table 1: Demographic characteristics and some risk factors of type 2 diabetes patients in the intervention (n=34) and control (n=18) groups.
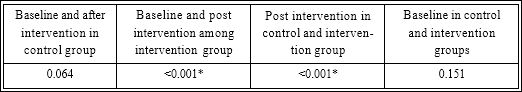
Table 2: P-value Comparisons among control and intervention groups before and after intervention.
*Are significantly different at p<0.05
Dietary diversity scores of type 2 diabetic patients within the intervention and control groups before and after intervention
The results for dietary diversity scores of type 2 diabetic patients within the intervention and control groups are presented in Figure 2. Results showed a significant (p<0.001) increase in the dietary diversity scores of type 2 diabetic patients within the intervention group. At baseline, the DDS of type 2 diabetic patients was lower (35.3%) in the intervention group than that in control group (40.08%) at baseline. At the end of the study, the intervention group that had a good DDS that is above 50% while the control group that had a poor DDS (below 50%).
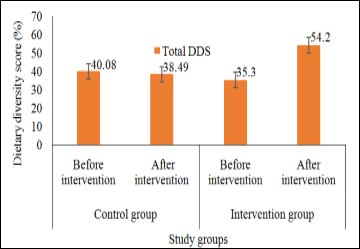
Figure 2: Mean Dietary Diversity Score (DDS) in type 2 diabetes patients before and after intervention in the intervention and control groups.
Discussion
The results in this study showed a significant (p<0.001) increase in the dietary diversity scores of type 2 diabetic patients within the intervention group. This is because their nutrition knowledge level increased after nutrition education and therefore started attaching value to having a high dietary diversity score. This implies that nutrition education positively affects the nutrition knowledge, and the behaviour of type 2 diabetic patients. The behaviour was demonstrated by patients who consumed a diverse diet as classified by [10]. A higher DDS is associated with lower levels of systolic and diastolic blood pressure, reduces probability of having diabetes, hypertriglyceridemia, hypercholesterolemia and hypertension especially when vegetable servings are observed [11]. A diverse diet helps in achieving both macronutrients and micronutrients that cannot be found easily in one food type [12]. The results of this study are similar to those of [13] in which introduction of nutrition education resulted into a significant increase in the dietary diversity scores. Her and Lee [14] also reported that nutrition education increased the dietary diversity scores among School Children in Korea. There was no study that reported results different from those seen in this study.
Conclusions
Nutrition education increased the practice of eating a diverse food groups diet (dietary diversity score) among patients with diabetes type 2. Nutrition education is successful in increasing DDS, diet quality of diabetic patients and therefore reduces the risk of disease.
Declarations
Ethical approval and consent to participate: The research was approved by the Research and Ethics committee of Mulago Hospital and Institutional Review Board of Mulago hospital (Protocol MREC 113). All participants consented to take part in study verbally and by written consent form
Competing interests: Authors declare no conflicts of interest
Funding: The study was funded by the Carnegie Corporation of New York.
Acknowledgements: The authors extend their heartfelt appreciation to the diabetes patients at Endocrine department, Mulago hospital and the hospital staff for their support during the study.
References
- Saeedi P, Petersohn I, Salpea P, Malanda B, Karuranga S, et al. (2019) Global and regional diabetes prevalence estimates for 2019 and projections for 2030 and 2045: Results from the International Diabetes Federation Diabetes Diabetes research and clinical practice 157: 107843.
- Kimutai SC (2020) Association between Nutrition Knowledge on Diabetes and Dietary Practice of People Living with Diabetes Mellitus in Nandi County. ActaScientific Nutritional Health 4: 18-27.
- Sinclair A, Saeedi P, Kaundal A, Karuranga S, Malanda B, et al. (2020) Diabetes and global ageing among 65-99-year-old adults: Findings from the International Diabetes Federation Diabetes Diabetes Research and Clinical Practice 108078.
- UBOS & ICF (2018)Uganda Demographic and Health Survey Kampala, Uganda and Rockville, Maryland, USA: UBOS and ICF.
- Webster-Gandy J, Madden A, Holdsworth M (2011) Oxford handbook of nutrition and dietetics. OUP Oxford.
- Chang S, Koegel K (2017) Back to basics: All about myPlate food Journal of the Academy of Nutrition and Dietetics 117: 1351-1353.
- American Diabetes Association (2019) Diabetes Supplement 1: 46-60.
- Mehrabani S, Mohammadifard N, Mehrabani S, Sadeghi M, Sajjadi F, et al. (2016) The effect of nutrition consultation on dietary diversity score of cardiac patients referred to cardiac rehabilitation research center isfahan cardiovascular research institute during 2008-2013. International journal of preventive medicine 7: 121.
- Sultana S, Lina NN, HasanMT, Ferdaus MJ, Dash BK, et (2020) Dietary Diversity and Associated Health Status of Newly Diagnosed Type 2 Diabetic Patients in Jashore Region of Bangladesh. Current Research in Nutrition and Food Science Journal 8.
- FAO (2008) Guidelines for measuring household and individual dietary diversity. Food and Agriculture Organization of the United Nations, Rome, Italy.
- Mirmiran M, Azadbakht L, Azizi F (2005) Association between dietary diversity score and cardiovascular risks in Tehranian adults. Iranian Journal of Endocrinology and Metabolism 7:189-198.
- Rathnayake KM, Madushani PAE, Silva KDRR (2012) Use of dietary diversity score as a proxy indicator of nutrient adequacy of rural elderly people in Sri Lanka. BMC Research Notes 5: 469.
- Oosthuizen D (2010) Impact of a nutrition education programme on nutrition knowledge and dietary intake practices of primary school children in Boipatong (Doctoral dissertation).
- Her ES, Lee KH (2003) Effect-evaluation of nutritional education program using internet for school children. Korean Journal of Nutrition 36: 500-507.
Citation: Mutagwanya R, Nyago CM, Nakwagala FN(2020) Effect of Diabetes Nutri- tion Education on Dietary Diversity Score of Type 2 Diabetes Patients. J Nutr Food Sci 3: 021.
Copyright: © 2020 Mutagwanya R, et al. This is an open-access article distributed under the terms of the Creative Commons Attribution License, which permits unrestricted use, distribution, and re- production in any medium, provided the original author and source are credited.