*Corresponding Author:
Esan AJ,
Hematology and Blood Transfusion Department, Federal Teaching Hospital, Ido-Ekiti, Nigeria
Tel: +234 8035477756
E-mail: ayodelejacob4u@gmail.com
Abstract
Background: Anaemia is a very common finding in patients living with HIV/AIDS, particularly in patients with advance stage. The frequency and severity of anaemia in HIV-patients increased with the decline in CD4 counts as HIV disease is progresses.
Aim: To determine the degree of anaemia and severity of HIV infection in HIV patients on ART and ART-naïve.
Methodology: This Study was carried out at Federal Teaching Hospital (FETHI), Ido Ekiti, Nigeria. One hundred (100) HIV positive subjects on ART and one hundred (100) HIV positive subjects ART naïve were the study population. Six milliliters (6ml) of whole blood was collected from each consented subject, 3ml was dispensed into 5ml K2EDTA bottle for immediate analysis of haemoglobin concentration, CD4 count, CD8 count and HIV screening. The remaining 3ml of blood was dispensed into plain bottle, allowed to clot and centrifuged at 2500 revolution per minute for 5minutes to extract the serum into another plain bottles, stored at-40°C for the analysis of erythropoietin and viral load.
Results: HIV ART-naïve and ART subjects had prevalence of 57% normocytic normochromic anaemia and 55% macrocytic normochromic anaemia respectively. Prevalence of severe anaemia in ARTnaïve and ART subjects were 56 and 16 respectively. Mean values of CD4, CD8, CD4/CD8 and EPO in Hb<8.0g/dl were lower compared to 8.0-9.9g/dl, Hb 10.0-12.9g/dl, and Hb>13.0g/dl among ART-naïve and ART subjects.
Conclusion: Degree of anaemia and severity of HIV-infection was higher in HIV-infected ART-naïve compared to HIV-infected on ART.
Keywords
Anaemia; ART/ART-naïve; Haemoglobin; HIV; Severity
Abbreviations
EPO: Erythropoietin
VL: Viral Load
CD4: Cluster of Differentiation 4
CD8: Cluster of Differentiation 8
HB: Haemoglobin Concentration
Introduction
Mechanisms by which anaemia occurs in HIV-patients have been postulated as decrease in red blood cell production, increase in red blood cell destruction and ineffective production of red cells [1]. The mechanism of HIV infection is cytotoxic to T-helper cell lymphocytes that lead dysfunction of B Cells and altered release of cytokines. HIV infected T-cells directly suppress the bone marrow progenitors which suppressing haemopoiesis, thus leads to anemia [2]. Anaemia is a very common finding in patients living with HIV/AIDS, particularly in patients with advance stage. Anaemia in HIV patients may occur as a result of HIV infection itself by direct effect of HIV virus on the bone marrow through the expression of pro-inflammatory cytokines that suppress erythropoiesis, as sequel of HIV-related opportunistic infections, or as a consequence of therapies used for HIV infection [3]. The frequency and severity of anaemia in HIV-patients increased with the decline in CD4 counts as HIV disease is progresses [4]. HIV infection alters red blood cell membrane fluidity, membrane protein activity and brings about changes in trans-membrane calcium transportation, these changes disrupt erythrocyte membrane stability, thus, promoting haemolysis and ultimately anaemia [5]. The aim of this study was to determine the degree of anaemia and severity of HIV infection in HIV patients on ART and ART-naïve.
Materials and Methods
Study design
This study was carried out at the ART Laboratory and Hematology Laboratory of the Federal Teaching Hospital (FETHI), Ido Ekiti, Nigeria. Study population was grouped into two, One Hundred (100) HIV positive subjects on ART, One Hundred (100) HIV positive subjects ART naïve. Consented HIV subjects were re-screened for HIV infection for the purpose of the study to confirm their HIV positive status using serial algorithm method. Patient’s consent was sort for through an informed consent form and ethical approval was obtained from Federal Teaching Hospital, Ido-Ekiti. Anaemia in this study was defined according to the World Health Organization (WHO) criteria; severe anaemia was defined as a haemoglobin level of less than 8.0g/ dl, Moderate anaemia was defined as a haemoglobin level of 8.0-9.9g/ dl, mild anaemia was defined as a haemoglobin level of 10.0-12.9g/dl normal haemoglobin value was define as Haemoglobin concentration (Hb) greater or equals to 13g/dl.
Sample collection and sample preparation
Six milliliters (6ml) of whole blood was collected from each consented subject, 3ml was dispensed into 5ml K2EDTA bottle for immediate analysis of haemoglobin concentration, CD4 count, CD8 count and HIV screening. The remaining 3ml of blood was dispensed into plain bottle, allowed to clot and centrifuged at 2500 revolution per minute for 5minutes to extract the serum into another plain bottles, stored at -40°C for the analysis of erythropoietin and viral load.
Inclusion criteria
- Confirmed HIV positive subjects
- Non pregnant women at the time of sampling
- ART naïve participants only not on any medication for at least three months prior to the time of sampling
- Participants were clinically stable with no active or symptomatic opportunistic infections.
- ART Participants only on drug for at least 3 months
Exclusion criteria
- Subjects with malignancy demanding cytotoxic chemotherapy or radiation therapy
- Subjects taking alcohol or smoking marijuana or cocaine
- HIV Subjects who are severely ill
- Subjects outside the age limit of the study population
- HIV positive subjects recently transfused
- HIV positive subjects undergoing haemolysis
- HIV positive subjects with viral load below detection
- Non consenting HIV positive subjects
Methodology
HIV screening test
Human immunodeficiency virus was diagnosed using serial algorithm method. Determine HIV-1/2 (Abbott Diagnostic Division, Belgium/Luxemburg), Uni-Gold HIV Kit (Trinity Biotech, Wicklow Bay, Ireland) and Chembio HIV½ Stat-PakTM Assay. Patients reactive to antibody screening tests were considered positive and recruited into the study; the test was carried out according to the manufacturer’s instruction.
Haemoglobin concentration
Haemoglobin concentration was analyzed using Hematology Analyzer (Sysmex XN 350 five parts) following manufacturer’s instruction.
Analysis of Cd4 and Cd8 count using flow cytometry (cyflow counter)
Research samples for CD4 and CD8 count was prepared and run on the Partec cyflow counter (Partec flow cytometer, GMBH, Munster, Germany) according to the manual instructions.
Viral load analysis
Extracted plasma from K2EDTA sample was used to estimate HIV- RNA viral load analysis using Polymerase Chain Reaction (PCR), the procedure was follow as describe in the manual.
Erythropoietin
Erythropoietin (EPO) was estimated using Enzyme-Linked Immunosorbent Assay (ELISA) kit, the procedure was followed as described in the manual [6].
Results
Table 1 shows the pattern of anaemia using red cell indices and red cell morphology. 57% of HIV ART-naïve subjects had normocytic normochromic anaemia, 22% had normocytic hypochromic anaemia, 17% had microcytic hypochromic anaemia and 4% had macrocytic normochromic anaemia. However, in HIV subjects on ART, 30% had normocytic normochromic anaemia, 10% had normocytic hypochro- mic anaemia, 5% had microcytic hypochromic anaemia and 55% had macrocytic normochromic anaemia. Figures 1 to 4 shows red cell morphology pattern of anaemia in this study.

Table 1: Shows the Pattern of Anaemia Using Red Cell Indices and Red Cell Mor- phology.
39% microcytic hypochromic anaemia, 57% normocytic normochromic anaemia and 4% macrocytic normochromic anaemia in ART-naïve while 15% microcytic hy- pochromic anaemia, 30% normocytic normochromic anaemia and 55% macrocytic normochromic anaemia in ART.
KEY: MCV<80=MICROCYTIC MCHC<32.2=LOW
MCV 80-100=NORMOCHROMIC MCHC 32.3-35.9=NORMAL
MCV>100=MACROCYTIC MCHC≥36=HIGH (MACROCYTIC)
MCH<27=HYPOCHROMIC MCH≥27 = NORMOCHROMIC

Figure 1: Macrocytic Normochromic Anaemia.
Table 2 showed the prevalence of anaemia in ART-naïve subjects were 56 severe anaemia with Hb<8.0g/dl, 19 moderate anaemia with Hb 8.0-9.9g/dl, 22 mild anaemia with Hb 10.0-12.9g/dl and 3 normal haemoglobin value Hb ≥ 13.0g/dl. Table 2 also showed comparison of CD4, CD8, CD4/CD8, VL and EPO on degree of anaemia in HIV infected subjects ART-naïve. The mean ± SD of CD4 214.73 ± 91.71 in Hb<8.0g/dl was significantly (P<0.05) lower compared to 388.68 ± 49.41, 407.50 ± 59.26 and 493.00 ± 21.37 in Hb 8.0-9.9g/dl, 10.0-12.9g/dl and Hb ≥ 13.0 g/dl respectively (F-value 50.79; P- value 0.00).
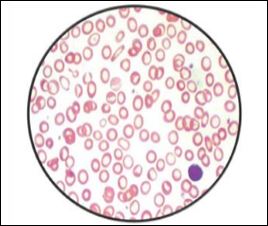
Figure 2: Microcytic Hypochromic Anaemia.
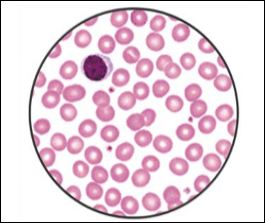
Figure 3: Normocytic Normochromic Anaemia.
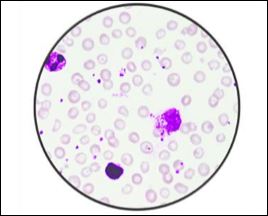
Figure 4: Normocytic Hypochromic Anaemia.
The mean ± SD of CD8 653.16 ± 193.22 in Hb<8.0g/dl was signifi- cantly (P<0.05) lower compared to 960.53 ± 110.69, 984.77 ± 93.01 and 996.33 ± 113.19 in Hb 8.0-9.9g/dl, 10.0-12.9g/dl and Hb ≥ 13.0g/dl re- spectively (F-value 33.03; P-value 0.00). The mean ± SD of CD4/CD8 0.34 ± 0.07 in Hb<8.0g/dl was significantly (P<0.05) lower compared to 0.42 ± 0.04, 0.42 ± 0.69 and 0.53 ± 0.06 in Hb 8.0-9.9g/dl, 10.0-12.9g/dl and Hb ≥ 13.0g/dl respectively (F-value 16.88; P-value 0.00). The mean ± SD of VL 167440.00 ± 100586.00 in Hb 8.0g/dl was signifi- cantly (P<0.05) higher compared to 91887.00 ± 20948.21, 77841.00 ± 13656.77 and 75103.00 ± 2362.76 in Hb 8.0-9.9g/dl, 10.0-12.9g/dl and Hb ≥ 13.0g/dl respectively (F-value 9.85; P-value 0.00). The mean ± SD of EPO 1.67 ± 0.47 in Hb<8.0g/dl was significantly (P<0.05) lower com- pared to 2.38 ± 0.73, 3.15 ± 0.37 and 3.40 ± 0.30 in Hb 8.0-9.9g/dl, 10.0-12.9g/dl and Hb ≥ 13.0g/dl respectively (F-value 52.43; P-value 0.00).
Multiple comparison between Hb 8.0-9.9g/dl and 10.0-12.9g/dl shows that, mean ± SD of CD4, CD8 and CD4/CD8 in Hb 8.0-9.9g/dl were lower compared to Hb 10.0-12.9g/dl although the difference was significant (P>0.05). Mean ± SD of VL in Hb 8.0-9.9g/dl was signifi- cantly (P<0.05) higher compared to Hb 10.0-12.9g/dl. Mean ± SD of EPO in Hb 8.0-9.9g/dl was significantly (P<0.05) lower compared to Hb 10.0-12.9g/dl. Multiple comparison between Hb<8.0g/dl and Hb 10.0-12.9g/dl shows that, mean ± SD of CD4, CD8, CD4/CD8 and EPO in Hb<8.0g/dl were significantly (P<0.05) lower compared to Hb 10.0-12.9g/dl. Mean ± SD of VL in Hb<8.0g/dl was significantly high- er compared to Hb 10.0-12.9g/dl. Multiple comparison between Hb 10.0-12.9g/dl and Hb ≥ 13.0g/dl shows that, CD4 in Hb 10.0-12.9g/ dl was significantly (P<0.05) lower compared to Hb ≥ 13.0g/dl. Mean ± SD of CD8, CD4/CD8 and EPO in Hb 10.0-12.9g/dl were lower compared to Hb ≥ 13.0g/dl although the difference was not significant (P>0.05). Mean ± SD VL in Hb 10.0-12.9g/dl was higher compared to Hb ≥ 13.0g/dl; the difference was not significant (P>0.05). Multiple comparison between Hb<8.0g/dl and Hb 8.0-9.9g/dl shows that mean ± SD of CD4, CD8, CD4/CD8 and EPO in Hb 8.0g/dl were signifi- cantly (P<0.05) lower compared to Hb 8.0-9.9g/dl. Mean ± SD of VL in Hb<8.0g/dl was significantly (P<0.05) higher compared to Hb 8.0-9.9g/dl. Multiple comparison between Hb 8-9.9g/dl and Hb ≥ 13.0g/ dl shows that mean ± SD of CD4 and EPO in Hb 8.0-9.9g/dl were significantly (P<0.05) lower compared to Hb ≥ 13.0g/dl, mean ± SD of VL in Hb 8-9.9g/dl was significantly (P<0.05) higher compared to Hb ≥ 13.0g/dl. Mean ± SD of CD8 and CD4/CD8 in Hb 8-9.9g/dl were lower compared to Hb ≥ 13.0g/dl although the difference was not sig- nificant (P>0.05). Multiple comparison between Hb<8.0g/dl and Hb ≥ 13.0g/dl shows that mean ± SD of CD4, CD8, CD4/CD8 and EPO in Hb<8.0g/dl were significantly (P<0.05) lower compared to Hb > 13.0g/dl. Mean ± SD of VL in Hb<8.0g/dl was significantly (P<0.05) higher compared to Hb ≥ 13.0g/dl.
Mean values of CD4, CD8, CD4/CD8 and EPO in Hb<8.0g/ dl were lower compared to 8.0-9.9g/dl, Hb 10.0-12.9g/dl, and Hb ≥ 13.0g/dl. Mean values of VL in Hb<8.0g/dl were higher compared to 8.0-9.9g/dl, Hb 10.0-12.9g/dl, and Hb ≥ 13.0g/dl among ART-naïve subjects. p<0.05 was considered significant, p>0.05 was considered not significant, F-value = mean ± SD of parameters was compared using ANOVA.
Table 3 showed the prevalence of anaemia in ART subjects were 16 severe anaemia with Hb<8.0g/dl, 12 moderate anaemia with Hb 8.0-9.9g/dl, 19 mild anaemia with Hb 10.0-12.9g/dl and 63 normal haemoglobin value Hb ≥ 13.0g/dl. Table 3 also showed comparison of immunological, virological and erythropoietin response on degree of anaemia in HIV-Infected subjects on ART parameters include CD4, CD8, CD4/CD8 VL and EPO. The Mean ± SD of CD4 100.00 ± 81.95 in Hb<8g/dl (severe anaemia) was significantly (P<0.05) lower com- pared to 250.50 ± 3.54, 325.63 ± 76.70 and 528.37 ± 80.54 in Hb 8.0 - 9.9g/dl (moderate), Hb 10.0 - 12.9g/dl (mild) and Hb ≥ 13.0g/dl (nor- mal) respectively (F-value 136.79; P-value 0.00). The mean ± SD of CD8 292.06 ± 131.65 in Hb<8g/dl (severe anaemia) was significantly (P>0.05) lower compared to 505.00 ± 7.07, 629.32 ± 79.59 and 758.97 ± 76.36 in Hb 8.0-9.9g/dl (moderate), Hb 10.0-12.9g/dl (mild) and Hb ≥ 13.0g/dl (normal) respectively (F-value 123.81; P-value 0.00). The mean ± SD of CD4/CD8 0.34 ± 0.12 in Hb<8.0g/dl was significantly (p<0.05) lower compared to 0.50 ± 0.00, 0.52 ± 0.09 and 0.68 ± 0.95 in Hb 8.0-9.9g/dl, Hb 10.0-12.9g/dl and Hb ≥ 13.0g/dl respectively (F-value 53.43; P-value 0.00).
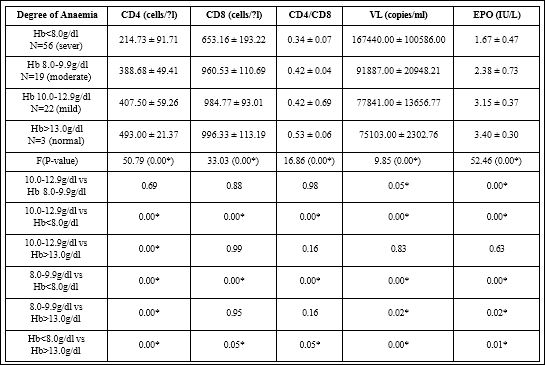
Table 2: Mean±Sd of Cd4, Cd8, Cd4/Cd8 and Epo on Degree of Anaemia in HIV Art-Naïve Subjects.
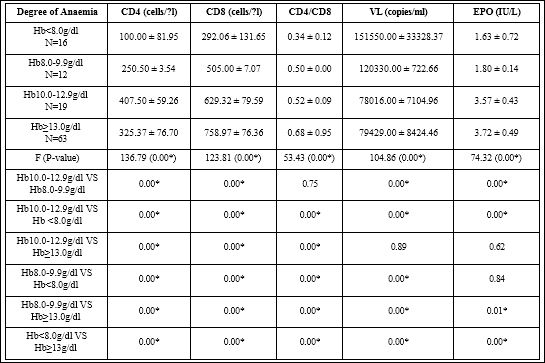
Table 3: Mean±Sd Of Cd4, Cd8, Vl And Epo On Degree Of Anaemia In HIV-Infected Subjects On Art.
The mean ± SD of VL 151550.00 ± 33328.37 in Hb<8.0g/dl was sig- nificantly (P<0.05) higher compared to120330.00 ± 722.66, 78016.00 ± 7104.96 and 79429.00 ± 8427.46 in Hb 8.0-9.9g/dl Hb 10.0-12.9 and Hb ≥ 13.0g/dl respectively (F-value 104.86; P-value 0.00). The mean ± SD of EPO 1.63 ± 0.72 in Hb<8.0g/dl was significantly (P<0.05) lower compared to 1.80 ± 0.14, 3.57 ± 0.43 and 3.72 ± 0.49 in Hb 8.0-9.9g/dl, Hb, 10-12.9g/dl and Hb ≥ 13.0g/dl respectively (F-value 74.32; P-val- ue 0.00). Multiple Comparison between Hb 10.0-12.9g/dl and Hb 8.0-9.9g/dl shows that, mean ± SD of CD4, CD8 and EPO in Hb 8.0-9.9g/dl were significantly (p<0.05) lower compared to Hb 10.0-12.9g/ dl. The mean ± SD of CD4/CD8 in Hb 8-9.9 was lower compared to Hb 10-12.9g/dl although the difference was not significant (P>0.05). Mean ± SD of VL in Hb8.0-9.9g/dl was significantly (p<0.05) higher compared to 10.0-12.9g/dl. Multiple Comparison between Hb<8.0g/dl and Hb 10-12.9g/dl shows that mean ± SD of CD4, CD8, CD4/ CD8 and EPO in Hb<8.0g/dl were significantly (p<0.05) lower com- pared to Hb 10.0-12.9g/dl. The mean ± SD of VL in Hb<8.0/dl was significantly (p<0.05) higher compared to Hb 10.0-12.9g/dl. Multiple comparison between Hb10.0-12.9g/dl and Hb ≥ 13.0g/dl show that, mean ± SD of CD4, CD8 and CD4/CD8 in Hb10.0-12.9g/dl were significantly (P<0.05) lower compared to Hb ≥ 13.0. Mean ± SD of VL and EPO in Hb 10.0-12.9g/dl were lower compared to Hb ≥ 13.0, the difference was not significant (P>0.05). Multiple comparison be- tween Hb<8.0g/dl and Hb8.0-9.9g/dl shows that, mean ± SD of CD4, CD8 and CD4/CD8 in Hb<8.0g/dl were significantly (P<0.05) low- er compared to Hb 8.0-9.9g/dl. The mean ± SD of VL in Hb<8.0g/ dl was significantly (P<0.05) higher compared to Hb8.0-9.9g/dl. The mean ± SD of EPO in <8g/dl was lower compared to Hb8.0-9.9g/dl although the difference was not significant (P>0.05). Multiple com- parison between Hb 8.0-9.9g/dl and Hb ≥ 13.0g/dl shows that mean ± SD of CD4, CD8, CD4/CD8 and EPO in Hb 8.0-9.9g/dl were signifi- cantly (P<0.05) lower compared to Hb ≥ 13.0. The mean ± SD of VL in Hb8.0-9.9g/dl was significantly (P<0.05) higher compared to Hb ≥ 13.0g/dl. Multiple comparison between Hb<8.0g/dl and Hb ≥ 13.0g/dl shows that, mean ± SD of CD4, CD8, CD4/CD8 and EPO in Hb<8.0g/ dl were significantly (P<0.05) lower compared to Hb ≥ 13.0g/dl. The mean ± SD of VL in Hb<8.0g/dl was significantly (P<0.05) higher compared to Hb ≥ 13.0g/dl.
Mean values of CD4, CD8, CD4/CD8 and EPO in Hb<8.0g/dl were lower compared to 8.0-9.9g/dl, Hb 10.0-12.9g/dl, and Hb ≥ 13.0g/dl. Mean values of VL in Hb<8.0g/dl were higher compared to 8.0-9.9g/ dl, Hb 10.0-12.9g/dl, and Hb ≥ 13.0g/dl among ART subjects. p<0.05 was considered significant, p>0.05 was considered not significant, F-value=mean ± SD of parameters was compared using ANOVA.
Discussion
Patterns of anaemia in this study were classified as normocytic normochromic, normocytic hypochromic, microcytic hypochromic and macrocytic normochromic anaemia with percentage of 57%, 22%, 17% and 4% respectively in HIV-infected ART-naïve subject while pattern of anaemia in HIV-infected subjects on ART were 30% nor- mocytic normochromic, 10% normocytic hypochromic, 5% micro- cytic hypochromic and 55% macrocytic normochromic. Findings in this study was similar to the report of Fekene, he reported 52.7% nor- mocytic normochromic anaemia, 32.2% macrocytic anaemia, 9.1% normocytic hypochromic anemia and 5.9% microcytic hypochromic anemia [7]. Similarly, Servais reported 43.3% normocytic normo- chromic, 23.3% normocytic hypochromic and 18.3% macrocytic nor- mochromic [8]. However, Swati reported that HIV-infected patients ART-naive had 66% normocytic normochromic anaemia while 42% HIV-infected patients on ART developed macrocytic anemia [9]. Sup- porting the findings in this study, patterns of anaemia was probably due to the effect of ART which is responsible for the development of macrocytic anaemia while development of normochromic normocyt- ic anemia in the study might due to Erythropoietin (EPO) deficien- cy. Microcytic hypochromic anaemia and normocytic hypochromic anaemia in this study might be due to nutritional deficiencies from iron, folic acid and vitamin B12 as a result of poor intake from reduced appetite and loss of nutrients from diarrhoea or from vomiting due to medication [10]. Degree of anaemia in this study corresponded to the severity of HIV infection. Percentage of anaemia in HIV ART-naïve is higher compared to HIV subjects on ART. Similar to the findings in this study, Volberding reported that the degree of anaemia in HIV-in- fected subjects is fairly related to immunosuppression and HIV dis- ease stages. Haemoglobin concentrations decrease significantly with increasing markers of disease progression [11]. Supporting the find- ings in this study, HIV infected anaemic subjects showed no signif- icant rise in serum Erythropoietin (EPO) levels, this confirmed that there is an inappropriate EPO response to anaemia in HIV infected patients, there is blunted response to EPO in HIV infected patients who have anaemia and suggested that blunting of the EPO response may be involved in the pathogenesis of the HIV-related anaemia [12]. The severity of anaemia was found to increase with the severity of the HIV infection but the level of EPO failed to increase commensurately, suggesting that one of the reasons for anaemia in HIV subjects was erythropoietin deficiency [13]. EPO level decline with advancing HIV disease, decrease in serum erythropoietin levels contribute to the ane- mia commonly observed in HIV infected patients as reported in this present study. Anaemia in HIV-infected on ART subjects were due to drug non-compliance which resulted into drug resistance, drug toxicity and organ failure as we discovered among HIV-ART sub- jects. Several studies have indicated that moderate to severe anemia is associated with increased disease progression and high mortality in ART-naïve and drug non-compliance ART HIV patients. Similar to the findings in this study, HIV patients on ART were found to have macrocytosis (MVC>100fl) as it gives a hint to the probable cause of the alteration in haematopoiesis, this type of anemia was reportedly caused by medication toxicity.
Conclusion
Degree of anaemia and severity of HIV-infection was higher in HIV-infected ART-naïve compared to HIV-infected on ART. Based on the findings in this study, there is improve haematological param- eters in ART subjects. However, anaemia in HIV-infected subjects on ART may be due to drug non-compliance resulting to HIV-virus re- sistance to drug, organ failure and drug toxicity.
References
- Okafor AO, Akwiwu EC, Akpotuzor JO (2019) Prevalence of anaemia after initiation of antiretroviral therapy among HIV-infected patients attending University of Calabar Teaching Hospital Calabar, International Journal of Tropical Disease and Health 35: 1-7.
- Ageru TA, Koyra MM, Gidebo KD, Abiso TL (2019) Anemia and its associated factors among adult people living with human immunodeficiency virus at Wolaita Sodo University teaching referral hospi Plos One. Pg no: 14.
- Modisa S, Motswaledi I, Kasvosve I, Oluwafemi OO (2013) The role of red blood cells in enhancing or preventing HIV infection and other Biomed research international 10: 55-62.
- Alamdo AG, Fiseha T, Tesfay A, Deber MK, Tirfe ZM, et al. (2015) Anemia and its associated risk factors at the time of antiretroviral therapy initiation in public health facilities of Arba Minch town, Southern Ethiopia. Health 7: 1657–1664.
- Ballah AD, Ibrahim YY, Hauwa SB, Ali UA, Abdullahi AB (2013) Changes in blood profile of Human Immunodeficiency Virus (HIV)-infected patients on Highly Active Antiretroviral Therapy (HAART) in North Eastern Academic Journals of AIDS and HIV Research 5: 284-291.
- ALPCO (2018) Quantitative determination of erythropoietin in human serum by ELISA. Catalog Number: 21-EPOHU-E01 1-12.
- Fekene TE, Leja HJ, Chernet HM, Dawit KW (2018) Prevalence of cytopenias in both HAART and HAART naïve HIV infected adult patients in Ethiopia: A cross sectional study. BMC Hematology 18: 1-11.
- Servais J, Nkoghe D, Schmit JC, Arendt V, Robert I, et al. (2001) HIV-associated hematologic disorders are correlated with plasma viral load and improve under highly active antiretroviral therapy. J Acquir Immune Defic Syndr 14: 221-225.
- Swati K, Permeet KB, Sita M (2016) Hematological manifestations in HIV infected patients and correlation with CD4 Counts and anti retroviral therapy. International Journal of Contemporary Medical Research 3: 3495-3498.
- Panwar A, Sharma SC, Kumar S, Sharma A (2016) A study of anemia in human immunodeficiency virus patients: Estimating the prevalence, analyzing the causative effect of nutritional deficiencies, and correlating the degree of severity with CD4 cell counts. Med J DY Patil Univ 9: 12-18.
- Volberding P (2002) The impact of anaemia on quality of life in human immunodeficiency virus-infected Journal of Infectious Disease 14: 110-114.
- Denu BA, Kida IM, Hammagabdo A, Dayar A, Sahabi MA (2013) Prevalence of anemia and immunological markers in HIV-infected patients on highly active antiretroviral therapy in Northeastern Nige- Infect Dis. 6: 25-33.
- Gatukui DK, Oyoo GO, Rajab J, Kayima J, Omonge E, et al. (2014) Serum erythropoietin in patients with anaemia on HAART attending the Kenyatta National Hospital, Comprehensive Care Centre. East African Journal of Pathology 1: 2-6.
Citation: Esan AJ, Osime EO, Titilayo EO (2020) Degree of Anaemia and Severity of HIV Infection in HIV Patients on Art and Art-Naïve. J Hematol Hemother 5: 010.
Copyright: © 2020 Esan AJ, et al. This is an open-access article distributed under the terms of the Creative Commons Attribution License, which permits unrestricted use, distribution, and re- production in any medium, provided the original author and source are credited.