*Corresponding Author:
Van Loan,
USDA-Western Human Nutrition Research Center, 430 West Health Sciences Drive, CA 95616, USA
Tel: +1 9253936276;
Fax: +1 5307525295;
E-mail: mdvanloan@ucdavis.edu
Abstract
Most research relating diet to bone health and osteoporosis has involved the roles of calcium, vitamin D and their synergistic activity; however, other nutrients have been shown to also play pivotal roles. In the present study, associations between other micronutrients and bone metabolism were investigated in twelve postmenopausal women in a randomized controlled trial. Subjects received a labeling dose of 100n Ci 41Ca and started a 180 days equilibration period for the isotope to stabilize in the skeleton followed by three 6-week phases, which included a calcium/vitamin D supplementation period and a dairy period in a cross over design, with a six week wash out period between interventions. Both interventions demonstrated positive effects on bone metabolism, as shown by a significant decrease in serum Carboxy Terminal collagen crosslinks (CTx), a marker of bone resorption. Regression models demonstrated that K, Na, Mg and folate were significant predictors of bone formation, as seen in baseline serum concentrations of Bone Alkaline Phosphatase (BAP), a marker of bone absorption. Following interventions Zn, K, Na, B-12 and protein were predictors on BAP with Zn the only significant predictor of resorption. In conclusion, while calcium and vitamin D are important to bone metabolism, other micronutrients also make significant contributions to bone health and need further investigation to better understand the mechanism of action and how the quality of the diet affects bone metabolism.
Keywords
Bone metabolism; Calcium; Micronutrients; Postmenopausal women; Vitamin D
Abbreviation
BAP - Bone Alkaline Phosphatase
CTx - Carboxy Terminal collagen crosslinks
Zn - Zinc
K - Potassium
Na - Sodium
Mg - Magnesium
BMD - Areal Bone Mineral Density
BMC - Bone Mineral Content
WO - Wash Out
Mg - Magnesium
P - Phosphorus
Introduction
Osteoporosis is a major health issue in the United States. It is a progressive bone disease resulting from an imbalance between bone resorption by osteoclasts and bone formation by osteoblasts, leading to a decrease in bone mineral density and an increase in fracture risk. Approximately 10 million adults have been diagnosed with osteoporosis, while an estimated 44 million have low bone mass [1]. It has been estimated that 2 million fractures yearly are attributed to osteoporosis, which amounts to about $17 billion dollars annually in medical costs [2]. A decline in bone mineral density in both men and women is inevitable and is part of the aging process that makes finding new preventative approaches vital for combating this disease [3].
The exact pathogenesis of osteoporosis has yet to be defined. It is thought that the cause of this disease is multifactorial and is influenced by genetic factors, gender, race, lifestyle and diet [4-8]. Recent evidence suggests that changes in diet and lifestyle are successful strategies to aid in the prevention and progression of osteoporosis [7,8]. Most research relating diet to bone health has involved the roles of calcium, vitamin D and their synergistic activity; however, other nutrients have been shown to also play a pivotal role.
An example of a mineral that is in need of additional examination relative to its role in bone health is magnesium. Magnesium is the fourth most abundant mineral in the body, 60% of which is stored in bone [9]. Although this mineral is found in a variety of foods including grains, nuts, cereals, legumes, green leafy vegetables, dairy, etc., various dietary intake studies suggest that most Americans are not fulfilling their magnesium requirement [10,11].
Interestingly, magnesium has been shown to play a role in bone metabolism by affecting the activity of factors involved in bone formation and resorption [12,13]. Magnesium helps in the stabilization of Amorphous Calcium Phosphate (ACP), which allows for more properly formed bone crystals [14]. It also influences calcium metabolism and regulates various hormones including parathyroid hormone and calcitriol, the active form of vitamin D [15-17].
In a randomized controlled trial in which the calcium and vitamin D intakes were fixed, we examined the associations and contribution of other micronutrients to bone metabolism in a group of postmenopausal women. We hypothesized that magnesium intake would significantly correlate with an increase in the bone formation marker BAP and a decrease in the bone resorption marker CTx. This examination was an exploratory analysis from a study that used the 41Ca isotope to deep label the skeleton to directly monitor resorption [18].
Materials and Methods
Subjects
Twelve healthy women, at least two years post menopause, completed the study protocol. Subjects were 50-65 years in age, were weight stable (±5 lbs. in the past three months), and classified as moderate low dairy consumers (≤ 2.5 dairy serving per day). Exclusion criteria included the use of oral hormone therapy in the past year, BMD T scores >0 or < -1.5, use of calcium or vitamin D all supplements, autoimmune or inflammatory disorders, history of non traumatic bone fracture and lactose intolerance. Subjects were recruited from the community via flyers, newspaper ads and email list serves, as well as informational booths at local farmers’ markets. The study was conducted at the USDA, Western Human Nutrition Research Center (WHNRC) on the University of California, Davis campus and was approved by the Institutional Review Boards of the University of California, Davis (#22919-7) and Lawrence Livermore National Laboratory (LLNL) (#11-008). All participants were informed of any potential risks and gave informed consent prior to beginning the study protocol. The study was registered at clinicaltrials.gov as NCT01394484.
Study design
The study consisted of a 180 day isotope equilibration period for the purposes of the parent study followed by three 6 week periods consisting of a dairy intervention and a supplement intervention in a cross over manner, separated by a 6 week Wash Out (WO) period. Details of the parent project have been previously reported [18]. For the purposes of this investigation we have focused on the three 6 week periods only and have not included the isotope equilibration period. Women were instructed to maintain their normal diet and lifestyle throughout all phases of the study.
Women were randomized to one of two 6 week interventions followed by a 6 week WO period, and then crossed over to the second intervention. The dairy intervention included 20 (1 cup) servings of milk (1% Lucerne, 400 mg calcium and 100 IU vitamin D per serving) per week and 8 (1 cup) servings of yogurt (low fat vanilla Yoplait, 200 mg calcium and 100 IU vitamin D per serving) per week. The supplement intervention consisted of a calcium supplement tablet (Caltrate, 600 mg calcium per tablet) two times per day and a vitamin D supplement tablet (400 IU vitamin D per tablet) once daily. The dairy intervention delivered ~1300 mg calcium and 400 IU vitamin D per day, and the supplements provided 1200 mg calcium and 400 IU vitamin D per day. Subjects were counseled on how to adjust their food intake to account for the added energy intake associated with the dairy servings (~an additional 350 kcal per day) and to not let the additional dairy effect their overall energy intake. The subjects underwent a 6 week WO period to eliminate any carryover effect of the first treatment when beginning the second treatment. Additionally, women were instructed to follow their usual low dairy diet during all phases of the study.
Completed 24 hours urine collections were used to determine loss of Ca and other minerals. These collections were made at the beginning of each intervention and continued weekly throughout both interventions and the WO. A total of 19 24 hours urine collections were made by each woman for the purpose of examining micronutrient excretion. Fasting blood was also drawn for determination of BAP and CTx bone markers at the beginning and end of each intervention; a total of 4 blood draws.
Compliance
Measures for the determination of compliance with the interventions have been present previously [18]. Participants received the dairy products or supplement tablets weekly. Compliance was determined via empty milk and yogurt containers returned by the women and by the number of missing tablets on the returned foil blister packs. Diet records were also kept during all phases of the study, including the provided dairy servings and supplement consumption as a secondary check on compliance. Based on returned empty dairy containers, pill blister packs and dietary logs, compliance was 100% throughout each phase of the study.
Dietary assessment
Information on dietary intake has been presented previously [18]. Participants maintained a 3 days food log on a weekly basis where the first day of the food log was randomly assigned and progressed sequentially the following weeks. To clarify, the first diet record might start on a Wednesday and continue through Friday of week 1. For the second week, the diet record started on Saturday and continued through Monday. This “rolling” sequence was utilized to provide an equal number of daily records for each day of the week; each day was recorded a total of 8 times and provided 56 days of diet records thoroughout the study. During the dairy intervention, women also recorded the number of dairy servings they consumed each day and this was used as an indicator of compliance. During the supplement intervention, women recorded their daily supplement consumption in their diet log as further documentation of compliance. Women were also interviewed by a registered dietitian weekly to further verify their dietary records.
The Nutrition Data System for Research (NDSR, University of Minnesota, 2011) was utilized for analysis of dietary records to determine intakes of energy, macronutrients, calcium, phosphorus, magnesium, sodium, potassium, zinc, saturated fat, monounsaturated fat, polyunsaturated fat, trans fat, vitamin D and servings of fruit, vegetables, grains, meat, nuts and seeds. In the case of a missing day’s food record nutrients were imputed into the data set based on the group average; thus not affecting the overall group average for any nutrient, but allowing for retention of all observations in the statistical analysis.
Urinary mineral analyses
Urine samples (10 mL) were acidified with 0.05 mL concentrated trace metal grade HCl (Sea Star Chemicals Inc, Sidney, Canada) prior to mineral analyses. Acidified urine samples were then centrifuged (1000 x g at 4 degrees Celsius) for 10 minutes. Allegra 6R (Beckman Coulter, Inc, Palo Alto, CA) was used to remove solid material. Urine samples were diluted with 1.0 N nitric acid (trace metal grade, Fisher Scientific, Pittsburgh, PA). A 1500 fold dilution was used for sodium, potassium and phosphorus, and a 150 fold dilution was used for calcium and magnesium. Inductively coupled plasma atomic emission spectroscopy (ICPAES, Varian Analytic Instruments, Walnut Creek, CA) was used to measure the concentration of minerals in the urine samples.
Anthropometric measurements
Body weight was measured to the nearest 0.1 kg using an electronic scale (Circuits and Systems Inc, E. Rockaway, NY). Standing height, without shoes, was measured to the nearest 0.1 cm with a wall mounted stadiometer (Ayrton stadiometer, model S100; Ayrton Corp, Prior Lake, MN). The determined weight and standing height were utilized to determine BMI (kg/m2).
Body composition and bone mineral density
Body composition (lean mass and fat mass), Bone Mineral Content (BMC) and areal Bone Mineral Density (BMD) of the spine and hip were determined using a Delphi W QDR Dual energy X-ray Absorptiometry (DXA) (Hologic Inc, Bedford, MA). DXA calibration was done daily in accordance with manufacturer instructions. The Coefficient of Variation (CV) for the DXA instrument during the course of the study was 0.457% for the lumbar spine BMD calibration phantom. A single licensed DXA technologist analyzed all DXA scans to decrease variance in measurement data.
Bone turnover markers
Serum C-terminal Teleopeptide of type 1 collagen (CTx) was measured by Enzyme Linked Immuno Sorbent Assay (ELISA) (Immunodiagnostic Systems Inc., Gaithersburg, MD). Bone specific Alkaline Phospatase (BAP) was measured by Enzyme Immunoassay (EIA) (Quidel, San Diego, CA).
Other variables
Because milk is a good source of B-12 and other related nutrients, and because there have been numerous studies that have shown a positive relationship between B-12 and bone metabolism, homocysteine, cysteine, folate and B-12 were analyzed during the interventions [19,20]. Concentrations of plasma Homocysteine (tHcy) and cysteine were found by high performance liquid chromatography with a fluorescence detector (Agilent 1200, Santa Clara, CA) [21].
Vitamin B-12 and folate were measured via chemiluminescence by Roche Cobas e411 (Roche Diagnostics, Indianapolis, IN). Serum Parathyroid Hormone (PTH) was measured by EIA (Quidel, San Diego, CA).
Statistical analysis
Sample size was determined for the parent study based on previous research using the radio isotope 41Ca as the primary outcome and has been shown to detect small amounts of calcium excretion and thus retention in the skeleton in a short time frame, e.g., 2 weeks [18]. Consequently, the sample size for this exploratory study was pre determined and fixed. However, the use of a cross over study design effectively increases the sample size and at the same time reduces the individual variability between treatment groups. For the exploratory study markers of bone metabolism were the primary outcome variables for and included BAP as a measure of bone formation and CTx as a marker of bone resorption.
Continuous variables were assessed for normality using Shapiro Wilk and D’Agostino Pearson normality tests and were transformed as appropriate. Nonparametric tests were used on data that were not conducive to transformation. Descriptive statistics were performed on baseline characteristics.
Associations among bone enhancing nutrients including protein and a variety of micro nutrients were evaluated using Pearson correlation. We also modeled the contribution of these nutrients to the markers of bone metabolism using stepwise multiple regression analysis to determine their contribution to the variance in bone markers and which micro nutrient (s) accounted for the greatest variance the bone turnover markers.
The effects of treatment and time for BAP, CTx, BAP, tHcy, cysteine, vitamin B-12 and folate were analyzed with two way analysis of variance (ANOVA) controlling for sequence or order effect of which treatment was received first vs. second and thus accounting for a possible carry over effect of treatment. Tukey’s multiple comparisons test was used to determine significant differences in the multiple comparisons. Percent change in CTx and BAP were compared by paired t test.
Urinary mineral excretion and intake of selected nutrients during each treatment and WO were compared using one way ANOVA with Tukey’s multiple comparisons test also controlling for sequence effect. Graph pad prism 6.0c (Graph Pad Software, Inc, La Jolla, CA) and SAS (Statistical Analysis System, ver 9.4; Cary NC) were used for statistical analyses.
Results
Average values of subject characteristics at baseline are shown in table 1. All participants were healthy post-menopausal women, with hip and spine bone densities at the low end of the normal range.
Serum values for BAP, CTx, homocysteine, cysteine, vitamin B12 and folate during the three phases are shown in Table 2. CTx significantly decreased between weeks 1 and 6 during the supplement (p<0.01) and dairy (p<0.0001) treatments, but no significant difference was found between the two treatments. No significant changes were seen in the remaining biomarkers.
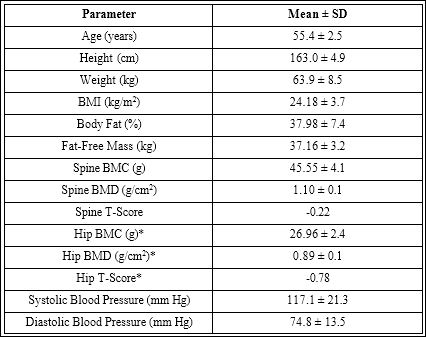
Table 1: Subject characteristics (n=12 females).
Values are means ± standard deviations.
BMC = Bone Mineral Content; BMD = areal Bone Mineral Density
*= average of left & right hip BMD.
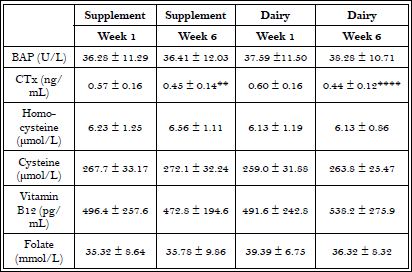
Table 2: Serum markers of bone metabolism, B-12 and B-vitamin related markers.
(n=12) Means ± Standard deviations; Significant differences between weeks 1 and 6 of each treatment are indicated with asterisks.
**p<0.01, ****p<0.0001
Mean 24 hour urinary mineral excretions for interventions and Wash Out (WO) are shown in Table 3. A significant difference (p<0.0001) in urinary calcium excretion was found between supplement and WO, but not between WO and dairy and there was no difference between treatment groups in urinary calcium excretion. Magnesium excretion among the treatments and WO were not statistically significant. Significant differences in urinary phosphorus were found across all three periods; both interventions and WO. The supplement group had the least amount of urinary phosphorus, WO an intermediate level, and dairy the highest level of Phosphorus (P) excretion. Urinary P excretion was greatest during the dairy treatment and is consistent with the increased phosphorus intake from milk. Similarly urinary potassium excretion was significantly greater (p<0.0001) in dairy compared to the supplement and WO. This is consistent with increased potassium intake from dairy foods, specifically milk. No significant difference was seen among the three periods for urinary sodium excretion.
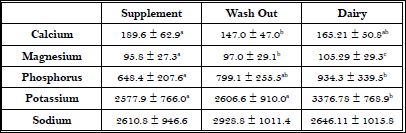
Table 3: Average urinary mineral excretion per intervention.
Values are means ± standard deviation; Different letters indicate significant differences between groups at the p<0.001 level of probability.
Mean intake of selected nutrients during the interventions and WO are shown in Table 4. There were missing diets records for three women, so, in order to retain data from all the women in the data set, missing dietary intake data were imputed using the group average for the missing days; doing so did not change the overall group means or standard deviations. Both treatments resulted in significantly greater intakes of calcium and vitamin D compared to WO. During the dairy phase, subjects had significantly greater intakes of carbohydrate, protein, vitamin A, phosphorus, zinc and potassium compared to the supplement and WO. The dairy treatment also resulted in significantly greater intakes of energy, folate, phosphorus and magnesium compared to the WO.
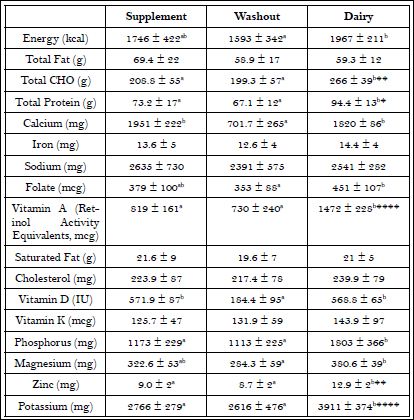
Table 4: Weekly average nutrient intake by intervention period.
Values are Mean ± Standard Deviation. Significant differences between supplement and dairy phases are indicated with letters and probability levels of significance with asterisks. *p<0.05, **p<0.01, ***p<0.001, ****p<0.0001
Associations among the bone markers and dietary intake are displayed in Table 5A-D. A significant association was observed between BAP and vitamin K pre and post supplement intervention. During the dairy intervention, folate and zinc were associated with bone biomarkers pre and post intervention (Table 5A-D).
Regression models to explain the contribution of the non calcium nutrients to markers of bone metabolism are shown in Table 6A-F. Prior to intervention, zinc, potassium, sodium, magnesium and folate accounted for 73% of the variation in BAP with potassium having the largest individual influence at 19% and magnesium the least effect at 11.6%. In contrast, the pre intervention model for CTx was explained by the Calcium to Magnesium (Ca/Mg) ratio (11.6%) and the calcium to zinc ratio (Ca/Zn) ratio (8.9%); explaining about 20% of the total variance in CTx.
Zinc was found to have one of greatest influences on BAP levels during supplement and dairy interventions, contributing 36% and 60% of the variance, respectively. Zinc also contributed significantly to the variance (70%) in CTx during the dairy intervention. In contrast, magnesium did not contribute to bone formation post supplement intervention and only contributed 2% to post dairy intervention. The influence of the calcium to magnesium ratio on CTx increased from 11% pre intervention to ~32% post supplement intervention.
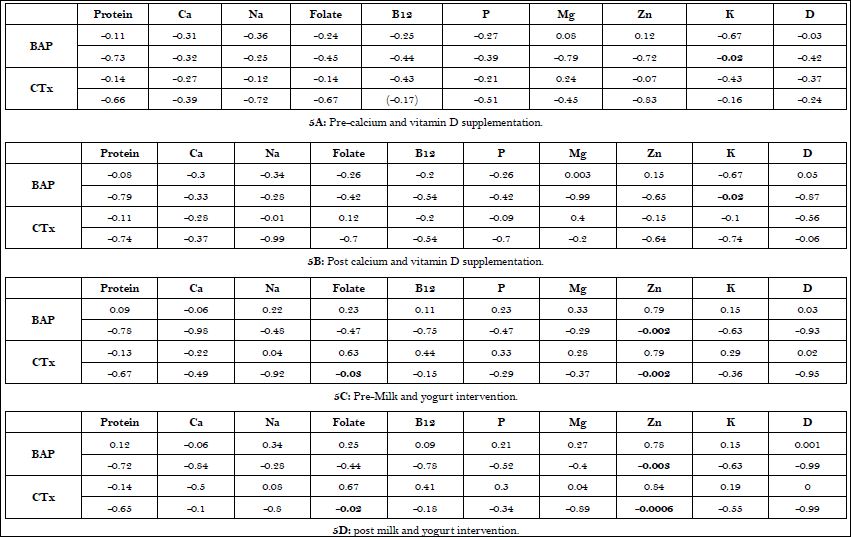
Table 5: Associations among dietary protein, micronutrients and markers of bone metabolism in postmenopausal women before and after supplement and dairy interventions.
Values are correlation coefficients with (p < level) below.
Discussion
Our results indicate that dairy foods were a better choice for the maintenance of bone health than calcium and vitamin D supplements as evidenced by a more positive effect on bone biomarkers as seen in the regression models. Although both interventions resulted in a decrease in osteoclast activity, as seen by the decline in CTx, the dairy intervention showed a greater significance (p<0.0001) than the supplement intervention (p<0.01) (Table 2), which indicates a more substantial decrease in bone resorption.
This effect may be attributed to increased micro nutrient intake from the dairy. These findings are consistent with other studies that investigated the effects of dairy on bone health [22,23]. A postmenopausal health study showed decreases in CTx, as well as favorable changes in BMD, with the addition of fortified dairy products into the diet compared to controls. Similarly, Heaney and associates reported favorable changes in bone turnover markers among healthy older adults who consumed supplemental milk for 12 weeks, further, suggesting benefits of increased dairy consumption [24].
Urinary excretion of both potassium and phosphorus significantly increased during the dairy intervention (Table 3), reflecting the nutrient density of dairy foods and the increased consumption of these minerals by the participants. Our dairy intervention also had significantly greater increases in consumption of carbohydrate, protein, vitamin A, zinc and potassium than the supplement intervention and washout period (Table 4). Significant increases in folate, phosphorus and magnesium were also seen in the dairy intervention compared to baseline (Table 4), but there were no significant differences in the intake of these minerals between the interventions. This is curious since dairy consumption generally increases the intake of these nutrients [25,26]. However, the women in this study generally ate well balanced diets based on their diet records, with the exception of a low number of dairy servings/day, and were able to match these nutrients during both interventions with their usual dietary intake.
Contrary to our hypothesis, magnesium was not significantly associated with any biomarker of bone metabolism during either the supplementation or dairy intervention (Table 5). This was contrary to our expectation because previous studies have shown positive correlations with magnesium intake and bone health by affecting hydroxyapatite formation and various hormones that influence osteoclast and osteoblast activity [12,13,26,27]. Additionally, various studies on both human and animal models have confirmed magnesium’s relationship with increased bone thickness [28,29,21,30]. The lack of significant correlations among Mg and bone markers in this study may be due to small sample size and a need for suboptimal intakes initially in order to demonstrate a positive impact on bone metabolism with a nutrition intervention [21]. Another potential explanation for our finding may be the potential lack of bioavailability of magnesium. Because dairy was the only source of increased levels of magnesium in the diet, it is possible that dairy magnesium may not be as readily bioavailable as it is in other food sources. Magnesium bioavailability could also be an age dependent factor. However both of these explanations are speculation and warrant further investigation to be confirmed.
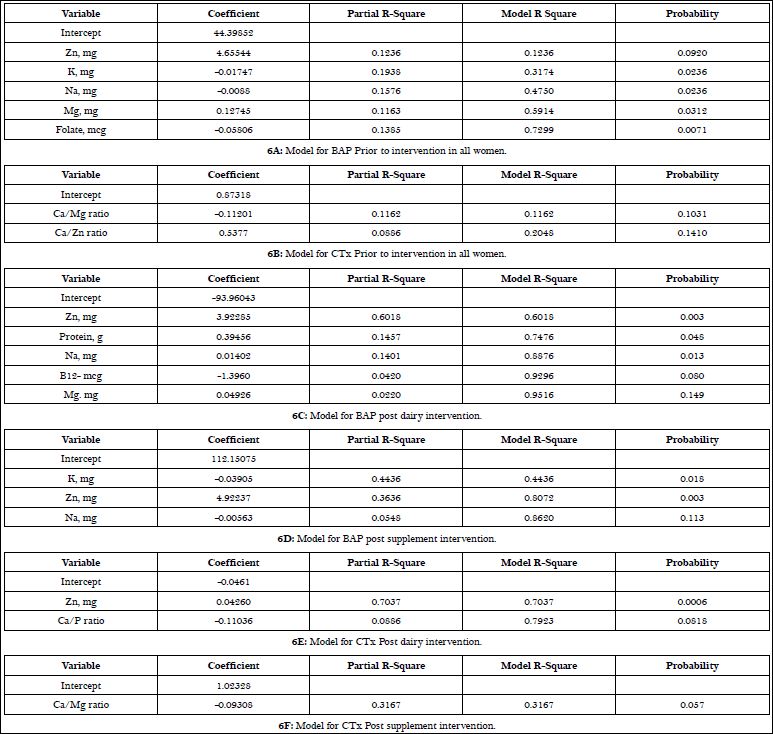
Table 6: Regression models of micronutrient contribution to markers of bone metabolism prior to and during supplement and dairy interventions.
In the regression models that accounted for the contribution of micronutrients to bone biomarkers during both interventions, zinc was involved in both formation and resorption (Table 6). Zn has been shown to increase bone formation by up regulating osteoblasts while decreasing osteoclast activity, however, more research needs to be done to elucidate the exact mechanism [21,30-32]. Contrary to our expectations, magnesium showed only a small contribution (2%) to explain bone formation with a dairy intervention (Table 6). This could be due, in part, to an insufficient ratio of calcium to magnesium as shown in the negative coefficient of Ca/Mg ratio in the CTx model during the supplementation intervention. Toba and associates demonstrated a correlation between calcium to magnesium ratios and increases in bone health, indicating that proper consumption of both nutrients are needed to have the most potent effect [29].
Interestingly, both interventions showed an increase in some micronutrients including folate, zinc, phosphorous and magnesium compared to baseline but there were no significant difference between both intervention periods (Table 4). A possible explanation for this is that the women who underwent the dairy intervention first grew accustomed to the increased servings of dairy and may have continued to incorporate slightly more dairy in their diet during the supplement intervention period. However, this was not confirmed.
This study does present with several limitations. Although this was an RCT, because we used a cross over design with each subject acting as her own control, the sample size was small (n=12). While the cross over design limits the between subject variability, it was not sufficient enough to counteract the small sample size. It should be noted that the sample size was calculated based on the parent project with the calcium isotope and not on bone markers.
Another limitation is the lack of racial and gender representation. The present study’s participants were post menopausal women and therefore not applicable to men or women of other age groups. Additionally, the racial diversity of the sample was limited to Caucasian women thus the results of this study cannot be generalized to those of different racial groups. Some nutrient requirements for men and women differ; therefore the change in diet that allowed for a significant difference in bone metabolism in the participants of our study may not be applicable to men. Additionally, studies have demonstrated that men and those of African descent have higher BMD and lower osteoporosis risk when compared to a middle aged Caucasian woman [5,31,32].
Contrary to some reported data that suggested a positive relationship between magnesium consumption and hydroxyapatite, calcium absorption, PTH and calcitriol, the results of the present study showed no significant association between magnesium intake and markers of bone health for either intervention [15,33-37]. Because nutrient consumption, specifically magnesium, was not controlled for in the present study, the effect of our interventions on skeletal health was the result of a synergistic effect of a variety of nutrients. In conclusion, while calcium and vitamin D are important to bone metabolism, other micronutrients also make a significant contribution to bone health and need further investigation to better understand the mechanism of action and how the quality of the diet affects bone metabolism.
Acknowledgement
We thank the women who participated in this study for their dedication to research on women’s health issues. We also thank Setti Shahab-Ferdows for her work with B-12 and associated analytes. Our thanks are also extended to the staff of the USDA-ARs-Western Human Nutrition Research Center’s Metabolic Kitchen staff for weighing, measuring and recording all dairy foods and supplements consumed by the participants. There were numerous interns that help to support the project from the Nutrition Department of the University of California that we also thank. USDA is an equal opportunity employer and provider.
Financial support
Funding was provided by the National Dairy Council adminis- tered by the Dairy Research Institute #393-5306-139 and by USDA, Agricultural research Service, Western Human Nutrition Research Center project # 20-2032-15-05-004D.
Authorship
MG and MDVL conceived of and designed the study, managed the conduct of the study, reviewed statistical analysis and assisted with manuscript preparation and review. ERG, CR, TSR and ED conducted the study, assisted with analytical laboratory work, conduced dietary intake assessment and review, reviewed statistical analysis and assisted with manuscript preparation and review.
References
- Kenny AM, Joseph C, Taxel P, Prestwood KM (2003) Osteoporosis in older men and women. Conn Med 67: 481-486.
- www.nof.org.
- Eisman JA (1995) Efficacy of treatment of osteoporotic fractures. Am J Med 98: 17-23.
- Sigurdsson G, Halldorsson BV, Styrkarsdottir U, Kristjansson K, Stefansson K (2008) Impact of genetics on low bone mass in adults. J Bone Miner Res 23: 1584-1590.
- Pollitzer WS, Anderson JJ (1989) Ethnic and genetic differences in bone mass: a review with a hereditary vs environmental perspective. Am J Clin Nutr 50: 1244-1259.
- Kohrt WM, Bloomfield SA, Little KD, Nelson ME, Yingling VR; American College of Sports Medicine (2004) American College of Sports Medicine Position Stand: physical activity and bone health. Med Sci Sports Exerc 36: 1985-1996.
- Seelig MS (1993) Interrelationship of magnesium and estrogen in cardiovascular and bone disorders, eclampsia, migraine and premenstrual syndrome. J Am Coll Nutr 12: 442-458.
- Lysen VC, Walker R (1997) Osteoporosis risk factors in eighth grade students J Sch Health 67: 317-321.
- Swaminathan R (2003) Magnesium metabolism and its disorders Clin Biochem Rev 24: 47-66.
- Bailey RL, Fulgoni VL 3rd, Keast DR, Dwyer JT (2011) Dietary supplement use is associated with higher intakes of minerals from food sources Am J Clin Nutr 94: 1376-1381.
- Rude RK, Gruber HE (2004) Magnesium deficiency and osteoporosis: animal and human observations J Nutr Biochem 15: 710-716.
- Kenney MA, McCoy H, Williams L (1994) Effects of magnesium deficiency on strength, mass, and composition of rat femur Calcif Tissue Int 54: 44-49.
- Rude RK, Gruber HE, Norton HJ, et al. (2005) Dietary magnesium reduction to 25% of nutrient requirements disrupts bone and mineral metabolism in Bone 37:211-219.
- Laurencin D, Almora-Barrios N, de Leeuw NH, Gervais C, Bonhomme C, et (2011) Magnesium incorporation into hydroxyapatite Biomaterials 32: 1826-1837.
- Wester PO (1987) Magnesium Am J Clin Nutr 45: 1305-1312.
- Fatemi S, Ryzen E, Flores J, Endres DB, Rude RK (1991) Effect of experimental human magnesium depletion on parathyroid hormone secretion and 1,25-dihydroxyvitamin D metabolism J Clin Endocrinol Metab 73: 1067-1072.
- Freitag JJ, Martin KJ, Conrades MB, Bellorin-Font E, Teitelbaum S, et al. (1979) Evidence for skeletal resistance to parathyroid hormone in magnesium Studies in isolated perfused bone. J Clin Invest. 64:1238-44.
- Rogers TS, Garrod MG, Peerson JM, Hillegonds DJ, Buchholz BA, et al. (2016) Is bone equally responsive to calcium and vitamin D intake from food supplements? Use of (41)calcium tracer kinetic model. Bone Rep 5: 117- 123.
- Gille D, Schmid A (2015) Vitamin B12 in meat and dairy products Nutr Rev 73: 106-115.
- Cagnacci A, Bagni B, Zini A, Cannoletta M, Generali M, et (2008) Relation of folates, vitamin B12 and homocysteine to vertebral bone mineral density change in postmenopausal women. A five-year longitudinal evaluation. Bone 42: 314-320.
- Odabasi E, Turan M, Aydin A, Akay C, Kutlu M (2008) Magnesium, zinc, copper, manganese, and selenium levels in postmenopausal women with oste- Can magnesium play a key role in osteoporosis? Ann Acad Med Singapore 37: 564-567.
- Tenta R, Moschonis G, Koutsilieris M, Manios Y (2011) Calcium and vitamin D supplementation through fortified dairy products counterbalances seasonal variations of bone metabolism indices: the Postmenopausal Health Eur J Nutr 50: 341-349.
- Gunn CA, Weber JL, Kruger MC (2014) Diet, weight, cytokines and bone health in postmenopausal women J Nutr Health Aging 18: 479-486.
- Heaney RP, McCarron DA, Dawson-Hughes B, Oparil S, Berga SL, et al. (1999) Dietary changes favorably affect bone remodeling in older adults J Am Diet Assoc 99: 1228-1233.
- Fulgoni VL 3rd, Keast DR, Auestad N, Quann EE (2011) Nutrients from dairy foods are difficult to replace in diets of Americans: food pattern modeling and an analyses of the National Health and Nutrition Examination Survey 2003 Nutr Res 31:759-765.
- Galan P, Preziosi P, Durlach V, Valeix P, Ribas L, et (1997) Dietary magnesium intake in a French adult population Magnes Res 10: 321-328.
- Elefteriou F, Campbell P, Ma Y (2014) Control of bone remodeling by the peripheral sympathetic nervous system. Calcif Tissue Int 94: 140-151.
- Goff JP (2014) Calcium and magnesium disorders. Vet Clin North Am Food Anim Pract 30: 359-381.
- Toba Y, Kajita Y, Masuyama R, Takada Y, Suzuki K, et (2000) Dietary magnesium supplementation affects bone metabolism and dynamic strength of bone in ovariectomized rats J Nutr 130: 216-220.
- Mutlu M, Argun M, Kilic E, Saraymen R, Yazar S (2007) Magnesium, zinc and copper status in osteoporotic, osteopenic and normal post-menopausal women J Int Med Res 35: 692-695.
- Lappe JM, Heaney RP (2012) Why randomized controlled trials of calcium and vitamin D sometimes fail Dermatoendocrinol 4: 95-100.
- Karieb S, Fox SW (2012) Zinc modifies the effect of phyto-oestrogens on osteoblast and osteoclast differentiation in vitro Br J Nutr 108: 1736-1745.
- Farr JN, Khosla S, Miyabara Y, Miller VM, Kearns AE 2013 Effects of estrogen with micronized progesterone on cortical and trabecular bone mass and microstructure in recently postmenopausal women. J Clin Endocrin Metab 98: 249-257.
- Liel Y, Edwards J, Shary J, Spicer KM, Gordon L, et al. (1988) The effects of race and body habitus on bone mineral density of the radius, hip, and spine in premenopausal women. J Clin Endocrinol Metab 66: 1247-1250.
- Jones G (2011) Early life nutrition and bone development in children. Nestle Nutr Workshop Ser Pediatr Program 68: 227-233.
- New SA, Bolton-Smith C, Grubb DA, Reid DM (1997) Nutritional influences on bone mineral density: a cross-sectional study in premenopausal women Am J Clin Nutr 65: 1831-1839.
- Blumenthal NC, Betts F, Posner AS (1977) Stabilization of amorphous calcium phosphate by Mg and ATP Calcif Tissue Res 23: 245-250.
- Norman DA, Fordtran JS, Brinkley LJ, Zerwekh JE, Nicar MJ, et al. (1981) Jejunal and ileal adaptation to alterations in dietary calcium: changes in calcium and magnesium absorption and pathogenetic role of parathyroid hormone and 1,25-dihydroxyvitamin D. J Clin Invest. 67:1599-1603.
Citation:Richardson CE, Rogers TS, Demmer E, Garrod M, Gertz ER, et al. (2017) Contribution of Micronutrients to Bone Metabolism in Post Menopausal Women Consuming a Fixed Amount of Calcium and Vitamin D: An Exploratory Study. J Nutr Food Sci 1: 003.
Copyright: © 2017 Richardson CE, et al. This is an open-access article distributed under the terms of the Creative Commons Attribution License, which permits unrestricted use, distribution, and reproduction in any medium, provided the original author and source are credited.