*Corresponding Author:
Marsha B Novick,
Department of Pediatrics, Penn State Milton S. Hershey Medical Center, Hershey, PA, USA
E-mail: mnovick@pennstatehealth.psu. edu
Abstract
Background: Research documents BMI improvements for children with obesity who undergo intensive behavior therapy (>26 contact sessions), but most hospital-based clinics have limited resources that allow only low-intensity intervention. The present study examines whether children with obesity in a pediatric low-intensity intervention improved over time, and whether demographics, intervention features, and extent of weight loss were associated with changes.
Methods: Retrospective chart reviews examined 11 outcomes from first and last (most recent) visits for children aged 2-17 years in a low-intensity weight management clinic in 2010-2018: weight status (%BMIp95), blood pressure (n=1014), and eight metabolic measures (n=532).
Results: Mean time between first and last visits was 19.4 months, with a mean of 5.6 visits. Significant improvements occurred for %BMIp95, SBP%, total cholesterol, LDL, triglycerides, ALT, insulin, and HbA1c. Improvements were independent of demographic or intervention characteristics except for SBP% (more improvement with more months) and %BMIp95 (less improvement with more months, more improvement with more visits and for children with higher obesity classes II and III). SBP%, triglycerides, and insulin showed clinically relevant improvements with mean %BMIp95 weight loss of 3.11%, 6.61%, and 6.73% respectively.
Conclusions: Children with obesity undergoing hospital-based low-intensity intervention showed significant improvements in %BMIp95, SBP%, and metabolic parameters across gender, age, and obesity severity. Future research should clarify “best practices” and treatment guidelines to enhance success of low-intensity intervention programs.
Introduction
Risks of comorbidities of childhood obesity
Pediatric obesity is producing serious childhood comorbidities originally considered “adult” diseases. Children with obesity show increased risk of cardiometabolic conditions like diabetes, hypertension, dyslipidemia, nonalcoholic fatty liver disease, and obstructive sleep apnea [1-5]. Presentation of these conditions in childhood dramatically increases risk of adverse health events in adulthood [2,6]. The International Childhood Cardiovascular Cohort (i3C) Consortium pooled data from 40,000 children age 3-19 years in longitudinal child cohorts in the US, Australia, and Finland, showing that 10% increases in childhood BMI and systolic blood pressure were associated with 20% and 40% greater risk of cardiovascular events later in life respectively [7]. Additionally, patients with two or more major cardiovascular risk factors both as children and adults showed six-fold greater risk of major cardiovascular events in early middle age than if they had two or more risk factors as adults but none as children [7].
Clearly, the presence of cardiovascular risk factors in childhood has consequences dwarfing those observed when the same factors present only in adulthood. However, emerging data suggests these patterns are not irreversible. For example a recent study found that patients who resolved non-HDL-C dyslipidemia by adulthood had normalized their risk of developing high carotid intima-media thick- ness in adulthood [8]. It is therefore imperative that children with obesity are treated with the intention of reducing the risk of medical comorbidities.
Interventions for child obesity
In 2017 the US Preventive Services Task Force’s Recommendation Statement on Screening for Obesity in Children and Adolescents found support for the effectiveness of comprehensive, intensive behavioral interventions in reducing children’s obesity [9]. Clinically significant BMI improvements (≥0.20 reduction in BMI z-score) occurred for intensive interventions (≥26 contact sessions over 2-12 months) but not for less intensive interventions (<26 sessions) [10,11]. Intensive interventions frequently included parent- and/or child-targeted sessions separately and/or together, family and group sessions, education on diet, exercise, and food labels; encouragement of stimulus control (e.g., limiting screen time and access to tempting foods), goal setting, self-monitoring, contingent rewards, problem solving, and supervised exercise sessions.
Unfortunately, such comprehensive interventions are not always feasible. Due to lack of insurance coverage for obesity treatment, many pediatric weight management clinics instead offer low-intensity interventions [12,13]. Furthermore, recent studies on the long-term effects of high-intensity interventions suggest children may actually regain their prior weight upon returning to real-world settings, due to difficulty generalizing the skills learned [14,15]. Intensive interventions may not be as helpful as hoped. Optimizing more accessible low-intensity programs is therefore imperative.
Research on low-intensity interventions is limited. The USPSTF found 24 trials, but only three showed statistically significant improvements and two of those studied overweight but not obesity [9]. Additionally, pediatric obesity research has recently shifted from BMI z-scores to a more reliable predictor of adiposity and outcomes across ages and for extreme weight statuses: %BMIp95, the child’s BMI percentage of the 95th percentile BMI for same-gender agemates [16- 18]. Early work suggests 5% reduction in %BMIp95 as an approximate threshold for clinically significant weight reduction [19], but further research with this metric is needed to better understand and improve the health of children with obesity.
Purpose of present study
The purpose of the present study was to broaden the limited research on changes in children with obesity after hospital-based low-intensity intervention. The present study expanded the set of outcomes typically considered to include 11 measurements of weight, blood pressure, and lab values relevant to the health of children with obesity: %BMIp95, systolic and diastolic blood pressure percentiles (SBP%, DBP%), total cholesterol, High and Low Density Lipoproteins (HDL, LDL), triglycerides, Alanine Transaminase (ALT), glucose, insulin, and hemoglobin A1c (HbA1c). Additionally, the present study offered one of few available examinations of how demographic (gender, age group, obesity class) and intervention characteristics (months between visits, number of clinic visits) were associated with changes. Such examination can clarify whether the low-intensity intervention is of possible benefit to widespread pediatric populations or only subsets.
Methods
Participants
Study participants included children with obesity referred by primary care clinicians and pediatric specialists to a South-Central Pennsylvania hospital-based pediatric weight management clinic during 2010-2018. This clinic cares for children aged 2-17 years with overweight and obesity, treated solely by physicians or physician assistants (i.e., not multidisciplinary). Standard of care in the clinic consists of recommendations from the American Academy of Pediatrics to decrease sugary drink intake, portion sizes, snacks, and screen time while increasing physical activity and fruit/vegetable intake [20]. Treatment is low-intensity as no prescribed program lasts over 26 contact sessions. Patients return to the office every 1-3 months based on provider availability and can discontinue treatment at any time. No patients were excluded from this study.
Sample 1 included 1014 children (41.8% White, 13.0% Hispanic, 12.6% Black, 32.5% other ethnicity) with two or more clinic visits spaced ≥ 3 months apart to give time for change. Sample 2 included 532 children (40.0% White, 16.2% Hispanic, 15.2% Black, 28.6% other ethnicity) with two or more laboratory visits, again ≥ 3 months apart. Sample 2 was smaller than Sample 1 because, with laboratory visits generally spaced further apart than clinic visits, fewer children had completed the necessary two laboratory visits (Sample 2, n=532) than clinic visits (Sample 1, n=1014) by time of retrospective chart review. Also, the sample of children available for each lab parameter varied (197-339) because not all children had all the cardiometabolic conditions that would clinically require tracking all eight measures per standard of care. Table 1 shows descriptive statistics for demographic and intervention characteristics of Samples 1 and 2.
Procedures and measurement
The Institutional Review Board at the academic institution approved procedures included in the present retrospective study. For Sample 1, demographic information was collected (gender and age) and blood pressure, height, and weight were obtained at first and last (most recent) clinic visit. Blood pressure was measured by manual sphygmomanometer using a Welch Allyn blood pressure cuff of the appropriate cuff size after children had been sitting for ≥ 5 minutes.
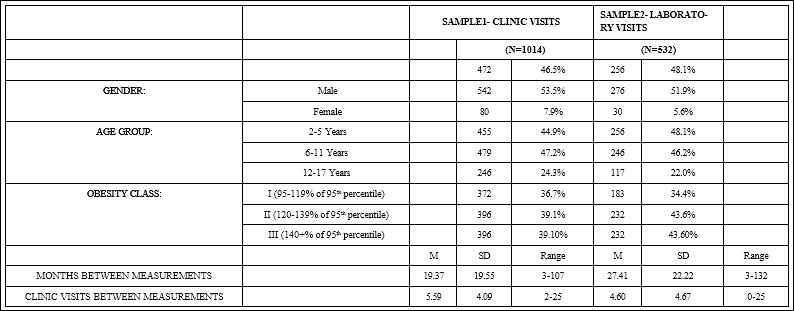
Table 1: Demographic and Intervention Characteristics of Children with Obesity from Sample 1 with 2+ Clinic Visits Across 3+ Months, and from Sample 2 with 2+ Laboratory Visits Across 3+ Months.
SBP% and DBP% were determined relative to same-gender age mates [21]. Height was measured by stadiometer (cm). Weight was measured by digital scale (kg). To determine weight status, the child’s BMI (kg/ m2) was divided by the 95th percentile BMI for same-gender agemates to yield %BMIp95, which established obesity severity: Class I (%BMIp95=95%-119%), II (120%-139%), and III (≥ 140%) [9,22,23].
Finally, each child’s charts were used to determine two intervention characteristics: number of months and clinic visits between first and last measurements.
Sample 2 included children with at least two visits for laboratory blood work, and demographic and intervention characteristics were collected as for Sample 1 (gender, age, obesity class, and number of clinic visits between and months between first and last (most recent) laboratory visits). Blood was drawn to determine one or more of eight values related to cardio metabolic comorbidities [10,24-29]: total cholesterol, LDL, HDL, triglycerides, ALT, glucose, insulin, and HbA1c.
Data analysis
Preliminary analysis was conducted using SPSS 26 software to obtain descriptive statistics for children’s demographics and intervention characteristics. The demographics included age group and gender. The intervention characteristics included number of visits between and months between first and last clinic or laboratory visits, and average number of clinic visits.
The first goal for data analysis of the present study was to examine whether each of the 11 measures collected for Samples 1 and 2 (%BMIp95, SBP%, DBP%, total cholesterol, LDL, HDL, triglycerides, ALT, glucose, insulin, HbA1c) showed significant changes from first to last clinic or laboratory visits. With each of the 11 measures considered as the outcome variable, SPSS 26 software was used to conduct one- way repeated-measures ANOVAs to compare the measure at the first and last visit. Table 2 shows the 11 measures at first and last visit, their changes between measurements (calculated as last – first), and results from these ANOVAs.
The second goal for data analysis was to examine whether demographic and intervention characteristics were associated with changes in each of the 11 measures from first to last clinic or laboratory visits (calculated as last-first). For all measures except HDL, improvements would be indicated by reduced values (negative change scores as calculated). For HDL, improvements would be indicated by increased values (positive change scores as calculated). For each of the 11 measures, SPSS 26 software was used to conduct linear regression analysis with the change from first to last visit being the outcome variable, and with predictor variables considered being gender (with dummy coding to compare females=1 to males=0), age groups (with dummy coding of 1 and 0 to compare children 6-11 years old to those 2-5 years old, and again to compare children 12-17 years old to those 2-5 years old), obesity classes (with dummy coding of 1 and 0 to compare class II to I, and again to compare class III to I), months between measures, and number of clinic visits between measures. Table 3 shows results for these multiple regression analyses.
The third goal for data analysis was to examine whether clinically relevant changes in children’s outcomes (SBP%, DBP%, total cholesterol, LDL, HDL, triglycerides, ALT, glucose, insulin, HbA1c) were associated with changes in their %BMIp95 (calculated as last – first, with negative values indicating weight loss and positive values indicating gain).
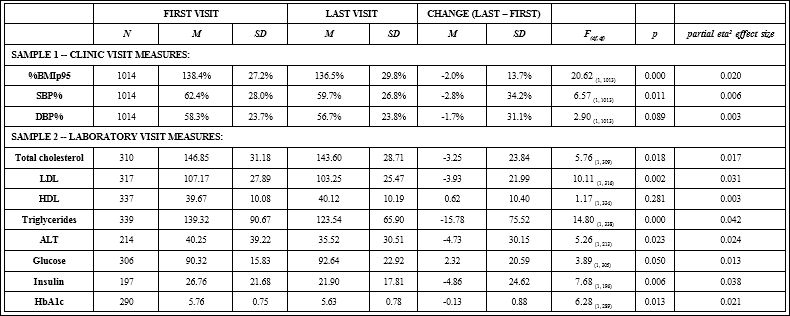
Table 2: Changes in Measures for Children with Obesity from First to Last Clinic Visits, and from First to Last Laboratory Visits.

Table 3: Linear Regression to Examine Demographic and Intervention Characteristics Associated with Changes in Measures Taken at First and Last Clinic Visits (Sample 1), and at First and Last Laboratory Visits (Sample 2), with Each Calculated as Last-First Values.
For each outcome, children with abnormal values on first measurement were selected. Clinically relevant change was defined as improvement of the outcome to “normal” by last measurement, with normal vs. abnormal defined by the academic center’s laboratory based on regional data: >95% for SBP% and DBP%, >200 mg/dL total cholesterol, >100 mg/dL LDL, <39 mg/dL HDL, >129 mg/dL triglycerides, >42 U/L ALT, >100 mg/dL glucose, >18mU/L insulin, >5.6% HbA1c. For each of the 10 outcomes, a t-test was conducted using SPSS 26 software to compare %BMI%p95 changes of the children whose outcome did vs. did not improve to normal levels. Table 4 shows the results of these comparisons.
Results
Changes in measures from first to last visits
Results from the one-way repeated-measures ANOVAs showed significant improvements (reductions) from first to last clinic or laboratory visits in eight of the 11 measures relevant to the health of children with obesity. The measures showing such improvements included weight status (2.0% decreased %BMIp95), systolic blood pressure (2.8% decreased SBP%), and lab values pertinent to cardiometabolic risks (decrease in total cholesterol 3.25 mg/dL, LDL 3.93 mg/dL, triglycerides 15.78 mg/dL, ALT 4.73 U/L, insulin 4.86 mU/L, HbA1C 0.13%) (Table 2).
Demographic and intervention characteristics associated with changes
Results from the multiple regression analyses revealed that gender and age were unrelated to changes in any of the 11 measures consid- ered. Obesity class was associated only with improvements (decreases) in %BMIp95, with children from classes II and III showing greater improvements than children from class I (Table 3).

Table 4: Changes in %BMIp95 from First to Last Clinic Visits for Children with Obe- sity Who Showed Abnormal Values at First Visit and Then Improved to Normal Val- ues, Compared to Children Who’s Values Remained Abnormal. Negative %BMIp95 Change Values Mean Children Lost Weight, Positive %BMIp95 Change Values Mean They Gained Weight.
Results from these multiple regression analyses also revealed that the intervention characteristic of more months between visits was associated with significant %BMIp95 worsening (increase) but significant SBP% improvement (decrease). Number of months between visits was unrelated to the other nine outcomes’ changes (DBP%, total cholesterol, LDL, HDL, triglycerides, ALT, glucose, insulin, HbA1c). The intervention characteristic of more clinic visits was associated with significant %BMIp95 improvement (decrease), with number of visits unrelated to the other 10 outcomes’ changes (SBP%, DBP%, total cholesterol, LDL, HDL, triglycerides, ALT, glucose, insulin, HbA1c) (Table 3).
Changes in %BMIp95 associated with clinically relevant improvements
For seven of the 10 outcomes considered (DBP%, total cholesterol, LDL, HDL, ALT, glucose, HbA1c), children with normalization of initially abnormal values showed no significant differences in %BMIp95 changes compared to children whose values remained abnormal. However, children with normalization of initially abnormal SBP%, triglycerides, and insulin did show significant differences in %BMIp95 change (mean %BMIp95 weight loss of 3.11%, 6.61%, and 6.73% respectively) compared to children whose values remained abnormal (mean gain of 3.23%, 1.67%, and 2.42% respectively) (Table 4).
Discussion
The present retrospective study examined how cardiometabolic risk factors changed in children with obesity referred to hospital-based low-intensity intervention. This intervention matched the USPSTF definition of a low-intensity program (<26 contact sessions) and did not have the multidisciplinary approach or intensive therapy typical of high-intensity programs. Despite lacking these features, the present study found significant improvements in children’s health parameters. Eight of 11 measures significantly improved from children’s first to last (most recent) visits to clinic or laboratory services: weight status (%BMIp95), blood pressure (SBP%), and indicators of cardiovascular health (total cholesterol, LDL, and triglycerides), liver function (ALT), and diabetes risk (insulin and HbA1c). These changes are important because they demonstrate participants are on their way to reducing their risk of cardiometabolic disease when treated with low-intensity intervention.
Additionally, the present study provides one of few available examinations of potential effects of child demographics and quantitative intervention characteristics on low-intensity intervention outcomes. Aside from %BMIp95 reductions being greatest for children with more severe obesity (classes II and III), significant improvements seen for the other nine measures (SBP%, DBP%, total cholesterol, LDL, triglycerides, ALT, glucose, insulin, HbA1c) were unrelated to demographic characteristics of gender, age group, or obesity class. Though the greater %BMIp95 reduction for the heaviest children was somewhat unexpected, this may be due to greater motivation in parent or child or greater diligence in their application of recommended behavior changes. Regardless, while the USPSTF suggested low-intensity interventions may be effective only in children with overweight [19], the present study showed that low-intensity intervention can indeed reduce %BMIp95 in children with obesity.
Regarding the intervention characteristics of months between and clinic visits between measurements, there was little precedent by which to establish expectations. These traits were not significantly associated with changes in any parameters except SBP% and %BMIp95. SBP% improved with more months between measurements and was unaffected by number of visits between measurements, suggesting that improving SBP% (after the initial clinician encounter) may not require much time investment on clinicians’ end. In contrast, %BMIp95 improved with more clinic visits between measurements but actually worsened with more months between measurements. While the former is intuitive, the latter suggests that patients and families may become fatigued with greater time in a weight management program. Lastly, the visit-related improvement in %BMIp95 occurred to a greater degree in patients with Class II and III obesity than in patients with Class I obesity. This may suggest that children with Class II and III obesity may derive greater benefit from more frequent visits than children with Class I obesity would..
Lastly, the present study examined whether significant and clinically relevant changes in outcomes (SBP%, DBP%, total cholesterol, LDL, HDL, triglycerides, ALT, glucose, insulin, HbA1c) were associated with %BMIp95 changes. Children with normalization of initially abnormal SBP%, triglycerides, and insulin showed significant differences in %BMIp95 changes (mean %BMIp95 weight loss of 3.11%, 6.61%, and 6.73% respectively) compared to children whose values remained abnormal (mean %BMIp95 gain of 3.23%, 1.67%, and 2.42% respectively), suggesting that 3.11% to 6.73% reductions in %BMIp95 were clinically significant weight loss. This contributes to preliminary work which had proposed 5% reduction as an approximate threshold [19].
Limitations
The present study had several limitations that should be acknowledged. Firstly, as a retrospective study it had no available control group, and there were significantly less children with two labs (versus two visits) since only clinically justified labs were collected. Additionally, the present study only assessed children with obesity referred to a single South-Central Pennsylvania pediatric weight management clinic, using regionally relevant lab cutoffs established by the university laboratory. The results of this study may therefore only be generalizable to pediatric populations with similar demographic characteristics. Furthermore, the present study’s blood pressure percentile calculations were based on the 2004 Fourth Report [21]. While this preserved comparability with recent studies still using the 2004 Fourth Report [19], the field will eventually need to transition to the 2017 Clinical Practice Guidelines [30].
Future Directions
Results from the present study point to many directions for future work. In light of the potential “fatigue” observed as %BMIp95 increased with more time between visits, research is needed to determine the optimal length of a low-intensity program, the ideal time to start its weight maintenance phase, and tools for keeping patients and parents engaged. Additionally, given that children with Class II and III obesity experienced greater %BMIp95 improvement with more clinic visits than did patients with Class I obesity, research may be needed to develop a nuanced approach with more treatment sessions for patients with Class II and III obesity compared to patients with overweight and Class I obesity. Other areas to explore include the impact of home health behaviors. Wrist-band technology or smart- phone daily checklists could record physical activity, diet, screen time, and sleep duration. Statistical analyses could then identify how changes in these behaviors are associated with changes in the 11 measures of the present study. More broadly, due to the recent switch from BMI z-scores, further work will be needed to establish what clinically significant weight reduction in %BMIp95 is.
A clinical trial could randomly assign children referred to the pediatric weight management clinic to either an intervention group or wait-list control group. The 11 measures of the present study could be collected from all children (control and intervention groups) at their first visit, three months, and six months to determine whether the intervention group showed significantly more improvement than children with obesity who received no intervention. A large scale clinical trial assessing children from weight management programs in multiple geographic regions could use nationally set laboratory standards to yield more generalizable results, also using the newer 2017 Clinical Practice Guideline to compute more up-to-date blood pressure percentiles [30].
Conclusions
One interpretation of the present study is that hospital-based low-intensity intervention can indeed improve weight status, blood pressure, and cardiometabolic outcomes in children with obesity. Although more intensive multidisciplinary behavioral interventions are recommended by the USPSTF [9], they require significantly more resources and time from clinicians and patients. Given pediatric weight management programs’ limited resources, future research should examine successful low-intensity programs to identify their high-impact components (e.g., focusing on dietary or behavioral changes, offering individual or group sessions, or focusing on medical co-morbidities rather than BMI). Cost-benefit analysis could help other programs determine which components to implement for their patients.
If low-intensity programs across the country can demonstrate high-yield population health improvements, their success may serve to advocate for and inform a national pediatric weight management program through the Affordable Care Act. Continued decreases in all- age morbidity and mortality, with concomitant decreases in health- care costs, would hopefully motivate a national mandate for coverage of weight management programs.
References
- Sinha R, Fisch G, Teague B, Tamborlane WV, Banyas B, et al. (2002) Prevalence of impaired glucose tolerance among children and adoles- cents with marked obesity. N Engl J Med 346: 802-810.
- Friedemann C, Heneghan C, Mahtani K, Thompson M, Perera R, et al. (2012) Cardiovascular disease risk in healthy children and its associa- tion with body mass index: Systematic review and meta-analysis. BMJ 345: e4759.
- Sorof J, Daniels S (2002) Obesity hypertension in children: A problem of epidemic proportions. Hypertension 40: 441-447.
- Lavine JE, Schwimmer JB (2004) Nonalcoholic fatty liver disease in the pediatric population. Clin Liver Dis 8: 549-558.
- Verhulst SL, Schrauwen N, Haentjens D, Suys B, Rooman RP, et al. (2007) Sleep-disordered breathing in overweight and obese children and adolescents: Prevalence, characteristics and the role of fat distribution. Arch Dis Child 92: 205-208.
- Cheung PC, Cunningham SA, Naryan KMV, Kramer MR (2016) Childhood Obesity Incidence in the United States: A Systematic Child Obes 12: 1-11.
- Dwyer T, Jacobs DR, Woo JG, Urbina EM, Bazzano L, et al. (2019) 1447Childhood risk factors and cardiovascular disease outcomes in adulthood. Preliminary findings from the International Childhood Cardiovascular Cohort (i3C) Consortium. Eur Heart J 40: 748-782.
- Juonala M, Wu F, Sinaiko A, Woo JG, Urbina EM, et (2020) Non-HDL Cholesterol Levels in Childhood and Carotid Intima-Media Thickness in Adulthood. Pediatrics 145: e20192114..
- Grossman DC, Bibbins-Domingo K, Curry SJ, Barry MJ, Davidson KW, et al. (2017) Screening for Obesity in Children and Adolescents: US Preventive Services Task Force Recommendation Statement. JAMA 317: 2417-2426.
- O’Connor EA, Evans CV, Burda BU, Walsh ES, Eder M, et (2017) Screening for Obesity and Interventions for Weight Management in Children and Adolescents: A Systematic Evidence Review for the U.S. Preventive Services Task Force. Rockville (MD): Agency for Healthcare Research and Quality (US).
- O’Connor EA, Evans CV, Burda BU, Walsh ES, Eder M, et al. (2017) Screening for Obesity and Intervention for Weight Management in Children and Adolescents: Evidence Report and Systematic Review for the US Preventive Services Task Force. JAMA 317: 2427-2444.
- Tsao-Wu M, Williams RJ, Hendy HM, Novick MB (2019) Associations between obesity severity and medical comorbidities for children with obesity in low intensity hospital intervention. Obes Res Clin Pract 13: 555-560.
- Seo Y-G, Lim H, Kim Y, Ju Y-S, Lee H-J, et (2019) The Effect of a Multidisciplinary Lifestyle Intervention on Obesity Status, Body Composition, Physical Fitness, and Cardiometabolic Risk Markers in Children and Adolescents with Obesity. Nutrients 11: 137.
- Hoedjes M, Makkes S, Halberstadt J, Noordam H, Renders CM, et al. (2018) Health-Related Quality of Life in Children and Adolescents with Severe Obesity after Intensive Lifestyle Treatment and at 1-Year Follow- Up. Obes Facts 11: 116-128.
- Zolotarjova J, Ten Velde G, Vreugdenhil ACE, (2018) Effects of multidisciplinary interventions on weight loss and health outcomes in children and adolescents with morbid obesity. Obes Rev 19: 931-946.
- Freedman DS, Butte NF, Taveras EM, Goodman AB, Ogden CL, et al. (2017) The Limitations of Transforming Very High Body Mass Indexes into z-Scores among 8.7 Million 2- to 4-Year-Old Children. The Journal of Pediatrics 188: 50-56.
- Freedman DS, Butte NF, Taveras EM, Lundeen EA, Blanck HM, et al. (2017) BMI z-Scores are a poor indicator of adiposity among 2- to 19-year-olds with very high BMIs, NHANES 1999-2000 to 2013-2014. Obesity 25: 739-746.
- Kuczmarski RJ, Ogden CL, Grummer-Strawn LM, Flegal KM, Guo SS, et al. (2000) CDC growth charts: United States. Adv Data: 1–27.
- Kumar S, King EC, Christison AL, Kelly AS, Ariza AJ, et (2019) Health Outcomes of Youth in Clinical Pediatric Weight Management Programs in POWER. The Journal of Pediatric 208: 57-65.
- Sandra GH (2010) In: Weight Maintenance and Weight Loss. Performing Preventative Services: A Bright Futures Handbook. Tanski Susanne, LCG, Duncan Paula M, Weitzman Michael, editors. American Academy of Pediatrics. pp. 185-190.
- National High Blood Pressure Education Program Working Group on High Blood Pressure in Children and Adolescents (2004) The Fourth Report on the Diagnosis, Evaluation, and Treatment of High Blood Pressure in Children and Adolescents. Pediatrics 114: 555-576.
- Flegal KM, Wei R, Ogden CL, Freedman DS, Johnson CL, et (2009) Characterizing extreme values of body mass index-for-age by using the 2000 Centers for Disease Control and Prevention growth charts. Am J Clin Nutr 90: 1314-1320.
- Gulati AK, Kaplan DW, Daniels SR (2012) Clinical tracking of severely obese children: a new growth chart. Pediatrics 40: 1130-1136.
- Hokanson JE, Austin MA (1996) Plasma triglyceride level is a risk factor for cardiovascular disease independent of high-density lipoprotein cholesterol level: A meta-analysis of population-based prospective J Cardiovasc Risk 3: 213-219.
- DeFronzo RA, Ferrannini E (1991) Insulin resistance. A multifaceted syndrome responsible for NIDDM, obesity, hypertension, dyslipidemia, and atherosclerotic cardiovascular Diabetes Care 14: 173-194.
- Eckel RH, Grundy SM, Zimmet PZ (2005) The metabolic Lancet 375: 181-183.
- Umer A, Kelley GA, Cottrell LE, Giacobbi P, Innes KE, et al. (2017) Childhood obesity and adult cardiovascular disease risk factors: A systematic review with meta-analysis. BMC Public Health 17: 683.
- Freedman DS, Mei Z, Srinivasan SR, Berenson GS, Dietz WH (2007) Cardiovascular Risk Factors and Excess Adiposity Among Overweight Children and Adolescents: The Bogalusa Heart Study. The Journal of Pediatrics 150: 12-17.
- Schwimmer JB, Dunn W, Norman GJ, Pardee PE, Middleton MS, et (2010) SAFETY study: Alanine aminotransferase cutoff values are set too high for reliable detection of pediatric chronic liver disease. Gastroenterology 138: 1357-1364.
- Flynn JT, Kaelber DC, Baker-Smith CM, Blowey D, Carroll AE, et al. (2017) Clinical Practice Guideline for Screening and Management of High Blood Pressure in Children and Adolescents. Pediatrics 140: 1904.
Citation: Tsao-Wu M, Hendy HM, Williams RJ, Novick MB (2021) Changes in BMI, Blood Pressure, and Metabolic Parameters for Children with Obesity Referred to Hospital-Based Low-Intensity Intervention. J Obes Bod Weig 2: 003.
Copyright: © 2021 Tsao-Wu M, et al. This is an open-access article distributed under the terms of the Creative Commons Attribution License, which permits unrestricted use, distribution, and reproduction in any medium, provided the original author and source are credited.