*Corresponding Author:
Peerayuht Phuangphung,
Department of Forensic Medicine, Siriraj Hospital, Mahidol University, Bangkok, Thailand
Tel: +66 2419580
Email: peerayuht.phu@mahidol.ac.th
Abstract
Urinary Hippuric Acid (HA) is one of the biomarkers for toluene abuse. However, HA can be an endogenous compound excreted in normal urine. Background urinary HA concentrations were available for Thai living people but there is still no data for Thai postmortem cases. Thus, this study aims to determine urinary HA concentrations in Thai postmortem cases and related factors that have an effect on urinary HA concentrations. Postmortem urine samples were collected from Thai cadavers aged 18-60 years old who were sent for medico-legal autopsies at the Department of Forensic Medicine, Siriraj Hospital, Mahidol University between 18th June 2020 and 31st December 2020. Case profiles including sex, age, Postmortem Interval (PMI) and liver pathology were recorded. Urinary HA concentrations were analyzed using High Performance Liquid Chromatography (HPLC) coupled with Photodiode Array (PDA) detector. Descriptive statistics, Mann-Whitney U test and Kruskal-Wallis H test were analyzed where they were appropriate. There were 150 Thai postmortem cases recruited in this study. Urinary HA concentrations ranged from 15.31 to 692.91µg/mL and the mean and median concentrations were 162.17 and 122.51µg/mL, respectively. There was no statistical difference in urinary HA concentrations between female and male subjects (p-value=0.724). Age produced highly statistical difference across the four age groups (p-value=0.008). The first lower age group (18-30 years old) showed significantly lower urinary HA concentrations than the other three age groups (31-40, 41-50 and 51-60 years old) (p-value=0.013, 0.005 and 0.003). PMI and liver pathology did not generate any statistical significance among their groups (p-value = 0.076 and 0.511). This study showed that age was the significant factor that had an impact on urinary HA concentrations in Thai postmortem cases.
Keywords
Hippuric acid; Postmortem; Thai; urine
Introduction
Hippuric Acid (HA) is an organic acid compound which is produced from the conjugation of benzoic acid with glycine in liver and is excreted into urine. HA is an endogenous metabolite that is present in normal human urine and can be used as a biomarker for several purposes like dietary intake and nephrolithiasis [1-3]. Dietary sources containing polyphenolic compounds especially flavonoid compounds in fruits and vegetables, tea and food preservatives are main sources for HA production [1-4]. HA is also an important urinary biomarker for toluene exposure. In forensic cases, the diagnosis of toluene abuse is performed using the determination of blood toluene and urinary toluene metabolites like HA and o-cresol [5,6]. However, factory workers who are exposed to toluene can have elevated urinary HA profiles [6,7]. Thus, the interpretation of urinary HA concentrations should be carefully performed and case history should be also considered.
Background urinary HA concentrations are essential for interpretation. According to previous studies, average urinary HA concentrations in non-exposed living people ranged from 222 to 790µg/mL [7-13]. When urinary HA concentrations were normalized with urinary creatinine concentrations, average urinary HA concentrations in non-exposed living people were reported between 90 and 700mg/g creatinine [4,5,14]. Decharat S studied about urinary HA levels in Thai living people and found that median urinary HA concentration in the non-exposure (control) people was 200mg/g creatinine (range=50580mg/g creatinine) [15]. Nevertheless, there is still no information of urinary HA levels in Thai postmortem people. Postmortem change is the important factor affecting body fluid after death. Creatinine in body fluid could be altered after death because creatinine could be released from muscle breakdown after death which was related to Postmortem Interval (PMI) and cause of death [16]. Therefore, normalization with urine creatinine may be problematic in postmortem cases. As urinary HA concentrations could be directly expressed in µg/mL [7-13] and there was a study reporting urinary HA concentration of a postmortem toluene abuser without normalization [17], this study will determine urinary HA concentrations in non-exposed Thai postmortem cases in µg/mL to avoid the potential effect of postmortem urine creatinine on urinary HA concentrations. Then, related factors which may have an effect on urinary HA concentrations will be assessed. This information will be useful for the interpretation of urinary HA concentrations in Thai postmortem cases.
Materials and Methods
Subject recruitment
All subjects in this study were recruited from medico-legal cases who were sent to Department of Forensic Medicine, Siriraj Hospital, Mahidol University, Thailand for autopsy between 18th June 2020 and 31st December 2020. The inclusion criteria were Thai people who were between 18 and 60 years old and had PMI until sample collection not greater than 24 hours. In addition, urine specific gravity (sp.gr.) should be in the reference range of 1.003-1.040 [18]. The exclusion criteria were Thai people who had histories of any underlying diseases regarding to relatives’ histories or had histories of any drug use. Furthermore, Thai people who had their occupations related to working in factories were excluded from this study. In addition, the analyses for drugs of abuse, volatile organic compounds and common medications were performed for all samples submitted for toxicological analysis. When their toxicological results were positive for any drugs, samples were also excluded from this study.
This research project was approved by the Institute Review Board of Faculty of Medicine, Siriraj Hospital, Mahidol University (COA No. Si 450/2020).
Sample collection and data recording
Urine samples approximately 30mL were collected from postmortem cases by drawing from urinary bladder during the autopsy procedure and were transferred into plastic bottles without preservatives following the forensic guideline [19]. Then, urine samples were transferred for storage in the refrigerator at 4°C in the laboratory. Urine samples were analyzed for HA concentrations using High Performance Liquid Chromatography (HPLC)-Photodiode Array Detector (PDA) in the next day. The analysis was performed in duplicate for each sample and the mean value was determined as the final result for that sample.
Subject data including sex, age, urine sp.gr., PMI, and liver pathology were recorded for each urine sample for statistical analysis. The age in this study was categorized into four groups: 18-30, 3140, 41-50 and 51-60 years old. PMI was classified into three groups: 0-8, 8-16 and 16-24 hours. Liver pathology could be defined based on gross and microscopic findings and then divided into two groups: liver with fatty change less than 50% and liver with fatty change more than 50% (as shown in figure 1).
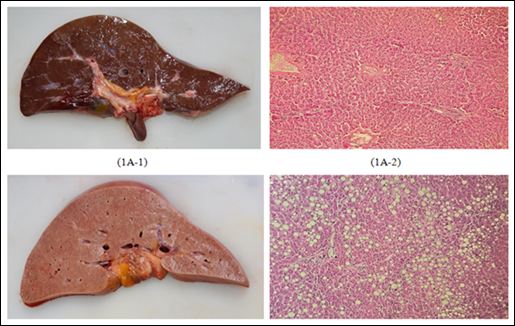
Figure 1: Gross and microscopic findings for liver pathology (1A: fatty change < 50% (1A-1: gross findings, 1A-2: microscopic findings), 1B: fatty change > 50% (1B-1: gross findings, 1B-2: microscopic findings)).
Chemicals and reagents
Hippuric acid 99.8% was sourced from Toronto Research Chemicals (TRC), Canada and 3-hydroxybenzoic acid (Internal standard, IS) 99% was obtained from Sigma-Aldrich, USA. Both of them were supplied by S.M. Chemical Supplies (Thailand) Co.Ltd. 37% Hydrochloric Acid (HCl), glacial acetic acid,sodium chloride (NaCl) AR grade, ethyl acetate AR grade, acetonitirle HPLC grade, methanol HPLC grade and synthetic urine(Surine®) were purchased from U&V Holding (Thailand) Co., Ltd. Deionized water (dH2O) was generated from Merck Millipore Direct-Q® 3 UV-R Water Purification System.
Instrumentation
The analysis of urinary HA was performed using a Waters Alliance 2695 High Performance Liquid Chromatography (HPLC) coupled with a Waters 2998 Photodiode Array (PDA) detector. Chromatographic separation was performed on Waters X Bridge C18 column (25 x 2.0mm, 5µm) using 78%:22% of 0.025% acetic acid in dH2O: acetonitrile in isocratic elution with flow rate 0.6mL/min held at 30°C. The injection volume was 20µL and total run time was 12 minutes. PDA detector was performed at 254 nm.
Sample preparation
Sample preparation was performed using liquid-liquid extraction [20]. Briefly, 1 mL of urine was pipetted into a conical tube and 20µL of 25mg/mL 3-hydroxybenzoic acid (IS) was spiked to obtain IS concentration 500µg/mL. Then, 80µL of 6 N HCl was added and vortexed. Next, 0.3 g NaCl was added. Extraction was performed using 4mL of ethyl acetate and the tube was shaken using a rotating mixer. Then, the tube was centrifuged at 3000 rpm for 5 minutes. After centrifugation, organic layer was transferred for drying with nitrogen stream at 30°C. Then, the sample was re-constituted with 80%:20% dH2O: acetonitrile 200µL and 20µL was injected into HPLC-DAD for the analysis.
Calibrators and Quality Control (QC) preparation
Stock HA and 3-hydroxybenzoic acid solutions were prepared in methanol at 100mg/mL. HA calibrator working solutions were prepared in methanol at 10 and 1mg/mL. 3-hydroxybenzoic acid working solution was prepared in methanol at 25mg/mL. Quality Control (QC) working solutions were also prepared in methanol at 10 and 1mg/mL. Calibration curves were prepared by spiking HA working solution into synthetic urine 1mL to achieve calibrator concentrations at 10, 20, 50, 100, 200, 500 and 1000µg/mL. Three QCs were prepared in the similar way at 30, 150, 750µg/mL, respectively.
Method validation
Method validation was performed in accordance with US Food and Drug Administration (FDA) guidelines [21]. Method validation was performed using synthetic urine because HA was endogenous compound that could be found in normal urine. Validation parameters tested in this study were described below.
Selectivity and interference study was performed using synthetic urine. Firstly, Blank synthetic urine, blank synthetic urine spiked with IS and blank synthetic urine spiked with HA, o-methylhippuric acid, m-methylhippuric acid, p-methylhippuric acid and IS were extracted and chromatographic separation was observed between HA/ IS and three isomers of methylhippuric acid. Then, common drugs of abuse and prescribed drugs at 100µg/mL were extracted and then selectivity and interferences were assessed at specific HA retention time. Common drugs of abuse and prescribed drugs used to assess this parameter were: Amphetamine, methamphetamine, 3,4-methylenedioxy-methamphetamine, 3,4-methylenedioxy-amphetamine, 6-monoacetylmorphine, morphine, codeine, methadone, cocaine, benzoylecgonine, ketamine, delta-9-tetrahydrocannabinol, 11-nor-9carboxydelta-9-tetrahydrocannabinol, diazepam, alprazolam, amitriptyline, and nortriptyline.
Limit of Detection (LOD) and Lower Limit of Quantitation (LLOQ) were tested by spiking gradually decreasing concentrations of HA working solution into blank synthetic urine. LOD and LLOQ were considered at the lowest concentration which produced a Signalto-Noise Ratio (S/N) greater than 3 times and 10 times, respectively.
Linearity was evaluated using seven HA calibrators ranging from 10 to 1000µg/mL prepared in three replicates and run on five separate days. Calibration curves were generated using Waters Quick Start Empower 2 Software®Version 6.20 from back-calculated concentrations for each calibrator. Curve weighting factors were adjusted to obtain the best linear regression fit that achieved r2 ≥ 0.99 and accuracy of each calibrator within ±15% (for LLOQ within ± 20%).
Accuracy and precision were assessed by injection of five replicates of blank synthetic urine spiked with LLOQ (10µg/mL), low, medium and high concentrations of QC samples (30, 150 and 750µg/ mL) on five separate days. Acceptance criteria included accuracy for each QC within ± 15% and intra-day and inter-day precision for each QC ≤ 15% coefficient of variation (%CV).
Carryover was determined by injection of blank synthetic urine samples following spiked synthetic urine samples with HA at 1000, 2000 and 5000µg/mL and HA peak at specific retention time was observed. There should be no HA peak detected in blank synthetic urine samples. Extract stability of three QC samples was assessed for auto-sampler stability and stability in the fridge (4°C). Auto-sampler stability was evaluated by re-analysis of three replicates of three QC samples placed in auto-sampler for 72 hours. Stability in the fridge (4°C) was assessed by re-analysis of three QC samples stored in the fridge for 7 days. The analyte was considered stable if the accuracy was within ± 15% of the original concentration.
Statistical analysis
Statistical analysis was performed using SPSS for Window version 22. Descriptive statistics were analyzed for mean, median, range and standard deviation. Data were tested with Kolmogorov-Smirnov test and Levene’s test for equality of variance. As data were not normally distributed, Mann-Whitney U test and Kruskal-Wallis H test were employed for data comparison where they were appropriate. The statistical significance was set at p-value < 0.05.
Results
Method validation
Linearity was assessed for HA over 10 to 1000µg/mL using back-calculated calibrator concentrations. A suitable weighting factor was selected for the linear regression curve based on method accuracy. After curve weighting 1/x2 was applied, accuracy of all calibrators was acceptable and r2 was still ≥ 0.99. Linear regression with a weighting 1/x2 was the best fit resulting in acceptable linearity and accuracy for this method.
According to this study, LOD and LLOQ were determined as 5µg/ mL and 10µg/mL, respectively. The chromatograms of HA at LOD and LLOQ were shown in figure 2.
The results of accuracy and intra-day and inter-day precision of HA are shown in table 1. All values passed the acceptance criteria for accuracy and precision.
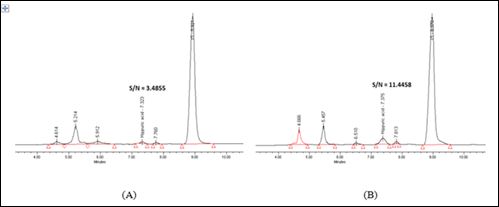
Figure 2: (A) LOD at 5µg/mL and (B) LLOQ at 10µg/mL.
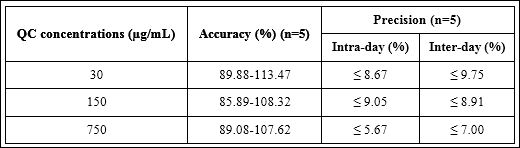
Table 1: Accuracy and precision of three QC concentrations.
No interference peaks from blank synthetic urine matrix, IS, and common drugs of abuse and prescribed drugs were observed at the RT of interest, approximately 7.3 minutes. HA and IS peaks were not interfered by three isomers of methylhippuric acids because they were achieved complete chromatographic separation from those peaks as shown in figure 3.
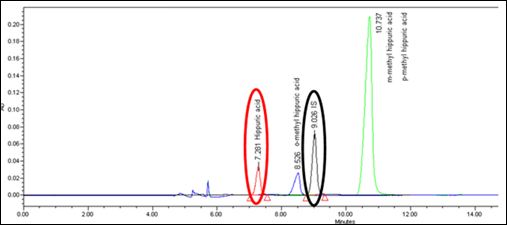
Figure 3: Chromatographic separation between HA (red circle), IS (black circle), and o-methylhippuric acid (blue peak), m-methylhippuric acid/p-methylhippuric acid (green peak).
No carryover was detected in blank synthetic urine samples following injection of HA concentrations up to 5000µg/mL. Overall auto-sampler stability for spiked synthetic urine at three QC concentrations was acceptable because the stability ranged from 90.90% to 93.87% of the original concentrations at 72 hours. These three QC concentrations were also stable in the fridge (4°C) for 7 days because all QC values at 7 days were 92.14-95.67% compared with the original concentrations.
This method was applied to authentic urine samples from Thai dead bodies recruited in this study to analyze urinary HA concentrations. Selected chromatograms of 50.79µg/mL and 187.73µg/mL were demonstrated at figure 4. It was shown that HA peak was not interfered by interference peaks because it was completely separated from adjacent interference peaks.
Results for HA analysis in urine samples from Thai postmortem cases
There were 150 urine samples recruited for HA analysis in this study. There were39 females (26%) and 111 males (74%) and the mean age was 40.9 years old. The range of urinary HA concentrations was15.31-692.91µg/mL. The mean and median urinary HA concentrations were 162.17 and 122.51µg/mL, respectively. Urinary HA concentrations in Thai postmortem cases were not normally distributed as shown in figure 5.
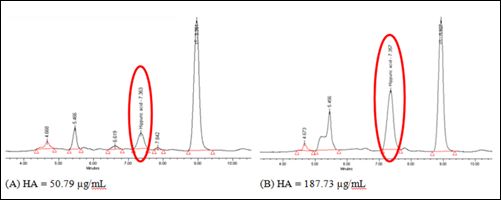
Figure 4: Selected Chromatograms from authentic urine samples from Thai cadavers at (A) 50.79µg/mL and (B) 187.73µg/mL.
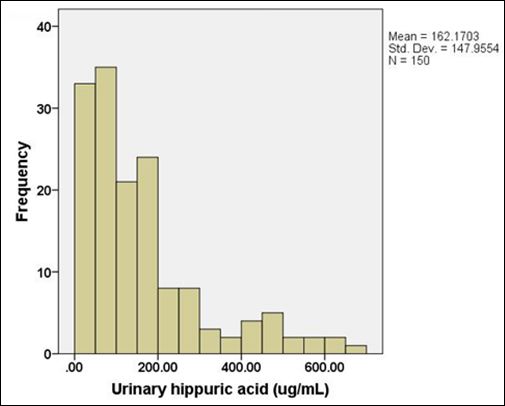
Figure 5: Data distribution of urinary HA concentrations in Thai postmortem cases.
The comparison of urinary HA concentrations between Thai male and female cases was shown in table 2 and figure 6. It was found that urinary HA concentrations in Thai female subjects were not significantly different from those in Thai male subjects (p-value = 0.724).
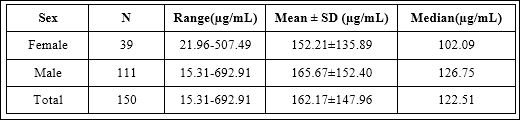
Table 2: Urinary HA concentrations between Thai male and female cases.
When age was considered, detailed information for each age group was shown in table 3. It was found that urinary HA concentrations demonstrated statistical significance across four age groups as shown in figure 7 (p-value=0.008). When pair wise comparisons were analyzed, urinary HA concentrations in the first lower age group (1830 years old) were significantly lower than the other three older age groups as shown in figure 7 (p-value=0.013, 0.005 and 0.003, respectively). However, the comparison within the other three age groups did not show any statistical significance.
When three PMI groups were compared, urinary HA concentrations in each PMI group were shown in table 4. The statistical analysis did not show any statistical significance among these three PMI groups as shown in figure 8 (p-value=0.076).
Lastly, liver pathology was considered for statistical analysis. Urinary HA concentrations from two groups of different liver pathologies were shown in table 5. It was found that there was no significant difference between two different degrees of fatty change in liver in this study (p-value=0.511) as shown in figure 9.
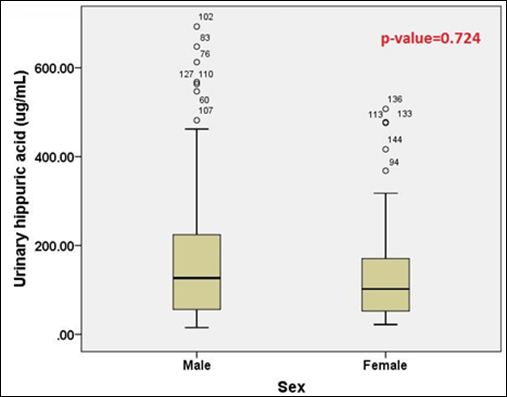
Figure 6: The comparison of urinary HA concentrations between Thai male and female cases.
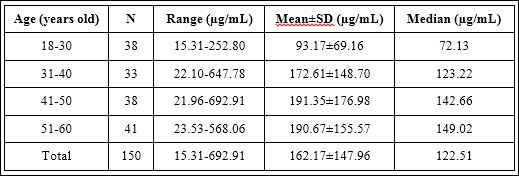
Table 3: Urinary HA concentrations between different four age groups.
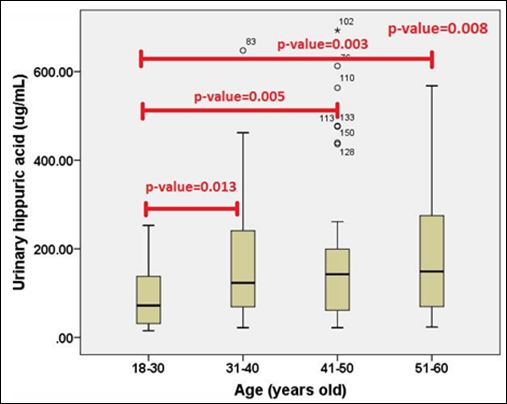
Figure 7: The comparison of urinary HA concentrations between different four age groups.
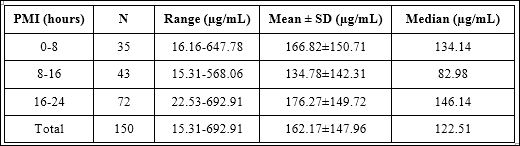
Table 4: Urinary HA concentrations among three PMI groups.
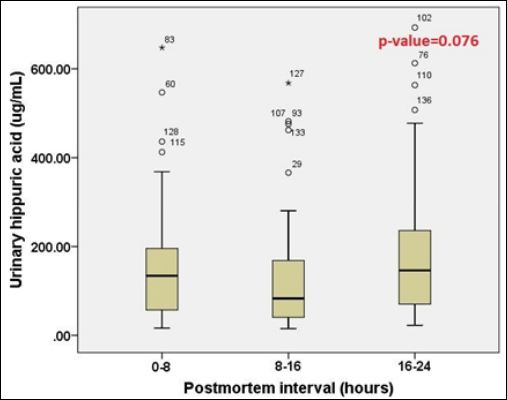
Figure 8: The comparison of urinary HA concentrations among three PMI groups.
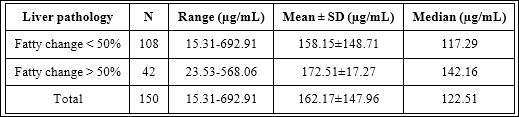
Table 5: Urinary HA concentrations between two liver pathology groups with different degrees of fatty change (fatty change < 50% and > 50%).
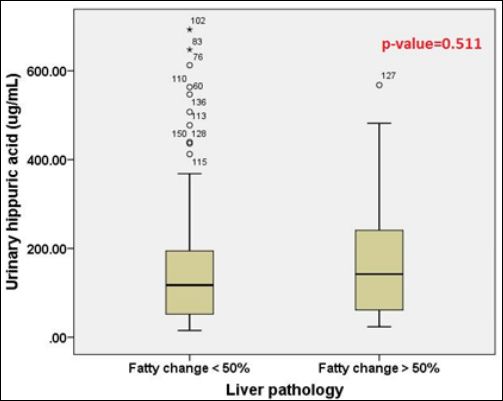
Figure 9: The comparison of urinary HA concentrations between two liver pathology groups with different degrees of fatty change (fatty change < 50% and > 50%).
Discussion
This study demonstrated that the range of urinary HA concentrations in Thai postmortem cases was 15.31-692.91µg/mL and the mean and median urinary HA concentrations were 162.17 and 122.51µg/ mL. The average urinary HA concentration in Thai postmortem cases was lower than previous studies which presented mean values ranging from 222 to 790µg/mL [7-13]. It could be postulated that ethnicity and characteristics of food intake might have an effect on urinary HA concentrations. The further study should be conducted to verify the normal urinary HA range in larger Thai postmortem cases. However, there was a report of the toluene abuser who was dead in fire presenting with urinary HA level of 1760µg/mL [17]. This level was higher than urinary HA range in this study. This range, therefore, would be a useful guidance for the interpretation of Thai postmortem cases.
Urinary HA concentrations in Thai male and female subjects did not show significant difference in this study. This finding was consistent with the previous study in Thai living people that reported no statistical significance between male and female populations [15]. However, this finding was different from previous studies. Siqueira ME and Paiva MJ conducted the study in Brazilian populations and reported that urinary HA concentrations in female people were significantly higher than those in male people [22]. Guerra A et.al also reported that although there was no significant difference in urinary HA concentrations between female and male people in Italy, female people were likely to have higher urinary HA concentrations than male people particularly in female people who were 36-45 years old [3]. As this study had small proportion of Thai female subjects and this may have an effect on this result. Further study should be conducted with larger proportion of Thai female populations to ensure the study outcome.
Age was the main factor affecting urinary HA concentrations in this study. The first lower age group (18-30 years old) was the only group presenting significant difference from the other three age groups whereas the other three age groups did not have any statistical significance among these three groups. In contrast to this study, Decharat S reported that there was no significant difference in urinary HA concentrations among different ages in Thai population [15]. However, this study outcome was partially consistent with several previous studies. The previous study showed that people who were 18-35 years old presented significantly lower urinary HA concentrations than those who were 36-60 years old [22]. In addition, it was found that urinary HA concentrations were positively correlated with increasing age until the age of 55 years old [3]. Furthermore, the positive association was found between urinary HA concentrations and increased intake of flavonoid compounds from fruits and vegetables [1-3,23]. It was also found that consumption of fruits and vegetables was positively associated increasing age [1-3]. Thus, previous studies implied that urinary HA concentrations were correlated with metabolism of polyphenol compounds obtained from food intake and this could partially explain the positive correlation between urinary HA concentrations and increasing age [1-3,23]. In addition, the previous study showed that old age groups showed higher urinary HA concentrations than younger age groups despite similar high polyphenol diet [24]. Thus, this study showed that urinary HA concentrations in Thai postmortem cases were also age-related.
PMI and fatty change in liver were the other two factors studied in this research and it was found that both factors did not have significant effects on urinary HA concentrations in Thai postmortem cases. However, there was some disproportionateness within PMI and liver pathology groups which might affect the outcome. In addition, this study did not recruit advanced liver disease like cirrhosis which might have an effect on liver enzyme activities responsible for endogenous HA production. These reasons might be limitations for the interpretation of these results. Thus, further study should be conducted to verify the impact of PMI and liver disease on postmortem urinary HA concentrations.
Conclusion
Urinary HA range in Thai postmortem cases in this study- was15.31-692.91µg/mL and the mean and median concentrations were 162.17 and 122.51µg/mL, respectively. Age was the only one factor which had an effect on urinary HA concentrations in this study whereas sex, PMI and liver pathology did not. This information could be useful for the interpretation of urinary HA concentrations in Thai postmortem cases.
Conflict of interest
The authors declare no conflict of interest.
Acknowledgement
This research project was supported by Siriraj Research Fund, Grant number (IO) R016331056, Faculty of Medicine, Siriraj Hospital, Mahidol University.
References
- 1.Krupp D, Doberstein N, Shi L, Remer T (2012) Hippuric acid in 24-hour urine collections is a potential biomarker for fruit and vegetable consump- tion in healthy children and adolescents. J Nutr 142: 1314-1320.
- 2.Penczynski KJ, Krupp D, Bring A, Bolzenius K, Remer T, et al. (2017) Relative validation of 24-h urinary hippuric acid excretion as a biomarker for dietary flavonoid intake from fruit and vegetables in healthy adoles- Eur J Nutr 56: 757-766.
- 3.Guerra A, Ticinesi A, Allegri F, Nouvenne A, Prati B, et (2019) Insights about urinary hippuric and citric acid as biomarkers of fruit and vegetable intake in patients with kidney stones: The role of age and sex. Nutrition 59: 83-89.
- 4.Villanueva MB, Jonai H, Kanno S, Takeuchi Y (1994) Dietary sources and background levels of hippuric acid in urine: Comparison of Philippine and Japanese Ind Health 32: 239-246.
- 5.Thiesen FV, Noto AR, Barros HM (2007) Laboratory diagnosis of tolu- ene-based inhalants abuse. Clin Toxicol (Phila) 45: 557-562.
- 6.Ukai H, Kawai T, Inoue O, Maejima Y, Fukui Y, et (2007) Comparative evaluation of biomarkers of occupational exposure to toluene. Int Arch Occup Environ Health 81: 81-93.
- 7.Kawai T, Ukai H, Inoue O, Maejima Y, Fukui Y, et al. (2008) Evaluation of biomarkers of occupational exposure to toluene at low levels. Int Arch Occup Environ Health 81: 253-262.
- 8.Ogata M, Sugihara R, Kira S (1977) Quantitative determination of urinary hippuric acid and m- or p-methylhippuric acid as indices of toluene and m- or p-xylene exposure by high performance liquid chromatography. Int Arch Occup Environ Health 39: 199-206.
- 9.Wilczok T, Bieniek G (1978) Urinary hippuric acid concentration after oc- cupational exposure to toluene. Br J Ind Med 35: 330-334.
- 10.De Rosa E, Bartolucci GB, Sigon M, Callegaro R, Perbellini L et (1987) Hippuric acid and ortho-cresol as biological indicators of occupational ex- posure to toluene. Am J Ind Med 11: 529-537.
- 11.Sakai T, Niinuma Y, Yanagihara S, Ushio K (1983) Simultaneous deter- mination of hippuric acid and o-, m- and p-methylhippuric acids in urine by high-performance liquid J Chromatogr 276: 182-188.
- 12.Yoshida M, Akane A, Mitani T, Watabiki T (2005) Simple colorimetric semiquantitation method of hippuric acid in urine for demonstration of toluene Leg Med (Tokyo) 7: 198-200.
- 13.Remane D, Grunwald S, Hoeke H, Mueller A, Roeder S, et al. (2015) Validation of a multi-analyte HPLC-DAD method for determination of uric acid, creatinine, homovanillic acid, niacinamide, hippuric acid, in- dole-3-acetic acid and 2-methylhippuric acid in human J Chromato- gr B Analyt Technol Biomed Life Sci.
- 14.Ikeda M, Ohtsuji H (1969) Hippuric acid, phenol, and trichloroacetic acid levels in the urine of Japanese subjects with no known exposure to organic Br J Ind Med 26: 162-164.
- 15.Decharat S (2014) Hippuric Acid levels in paint workers at steel furniture manufacturers in Saf Health Work 5: 227-233.
- 16.Maskell PD, Penney E, Smith PR, Hikin LJ, Morley SR (2019) Post-mor- tem diagnosis of kidney impairment: An experimental study. Forensic Sci Int 301: 271-277.
- 17.Ohshima T, Kondo T, Ohtsuji M, Minamino T, Nishigami J (1996 ) A case of death due to outbreak of fire during thinner abuse. Nihon Hoigaku Zasshi 50: 33-36.
- 18.Schnaper HW (2007) Case 8 Young Man with edema and decreased urine In: Scott MG, Gronowski AM, Eby CS (eds.). Tietz’s Applied Lab- oratory Medicine (2nd edn). John Wiley and Sons, New Jersey, USA.
- 19.Dinis-Oliveira RJ, Vieira DN, Magalhães T (2017) Guidelines for collec- tion of biological samples for clinical and forensic toxicological analysis. Forensic Sci Res 1: 42-51.
- 20.Centers for Disease Control and prevention (1984) Hippuric and meth- yl-hippuric acids in urine: Method 8301. NIOSH Manual of Analytical Centers for Disease Control and prevention, Georgia, USA.
- 21.U.S. Department of health and human services, Food and Drug Admin- istration Center for Drug Evaluation and Research, Center for Veterinary Medicine (2018) Bioanalytical method validation, Guidance for Industry. U.S. Department of health and human services, Food and Drug Adminis- tration Center for Drug Evaluation and Research, Center for Veterinary Medicine, Maryland, USA.
- 22.Siqueira ME, Paiva MJ (2002) Hippuric acid in urine: Reference values. Rev SaudePublica 36: 723-727.
- 23.Guerra A, Folesani G, Mena P, Ticinesi A, Allegri F, et (2014) Hippuric acid in 24 h urine collections as a biomarker of fruits and vegetables intake in kidney stone formers. Int J Food Sci Nutr 65: 1033-1038.
- 24.Alkhaldy A, Edwards CA, Combet E (2019) The urinary phenolic acid profile varies between younger and older adults after a polyphenol-rich meal despite limited differences in vitro colonic catabolism. Eur J Nutr 58: 1095-1111.
Citation:Tungjitrungroat N, Kaeomun D, Phuangphung P (2021) The Study of Fac- tors Affecting Urinary Hippuric Acid Concentrations in Thai Postmortem Cases. J Case Repo Imag 5: 039.
Copyright: © 2021 Tungjitrungroat N, et al. This is an open-access article distributed under the terms of the Creative Commons Attribution License, which permits unrestricted use, distribution, and reproduction in any medium, provided the original author and source are credited.