*Corresponding Author:
Xu Y,
Abbott Diabetes Care, 1360 S, Loop Road, Alameda, 94502, California, USA
Tel: +1 5108644416
Email: yongjin.xu@abbott.com
Abstract
Estimated A1c (eA1c), calculated from average sensor glucose, and HbA1c should be linearly correlated and approximately equal. We observed an interesting effect of age and diabetes duration on this correlation. There was a weak and direct correlation between eA1c and HbA1c (r2=0.63, p-value<0.001). Increasing age or older diabetic groups appear to be associated with weaker eA1c and HbA1c correlation (measured by R2), as well as decreasing and larger deviation from the theoretical slope. The observation suggests that disease progression and physical conditions may play a role in hemoglobin glycation in response to glucose concentration. At an individual level, the HbA1c-to-eA1c relationship may provide additional insight to physical conditions and disease progression.
Keywords
Average Sensor Glucose; Estimated A1c; Diabetes Duration; HbA1c
The estimated HbA1c (eA1c) can be calculated from average sensor glucose using the linear regression equation reported by Nathan and coworkers [1-3]. Theoretically, eA1c and HbA1c should be linearly correlated with a slope of 1, but deviations have been reported [4]. We observed an interesting effect of age and diabetes duration on this correlation in 92 subjects, with81 type1, 8 type 2and 3 Latent Autoimmune Diabetes in Adults (LADA) from clinidiabet outpatient diabetes technology clinic in Spain. These patients are white Spaniards, diverse in age (5 to 88) and diabetes duration (2 to 61 years), roughly even female (n=41) and male (n=51). Three LADA patents were 50 to 81 years in age and 6 to 24 years in diabetes duration. Within the type 1 patients (age range from 2 to 61 years) 7 were treated with Continuous Subcutaneous Insulin Infusion (CSII) and the rest with Multiple Daily Injections (MDI). The seven CSII patients (age range from 25 to 62 years) were not using a Continuous Glucose Monitoring (CGM) system. All type 2patients (age range from 50 to 88years) were on MDI and not on oral agents. The diabetes duration and age in this cohort are weakly correlated with R2=0.39. This cohortbiases to an aged population with 41 subjects in age group >60 years and only 6 and 10 subjects in young age groups of <10 and 10-20 years, respectively. There are 23, 25, 27, and 17 subjects in ranges of <10, 11-20, 21-30, and >30 years of diabetes duration, respectively, showing a relatively even distribution. Glucose levels were monitored by flash glucose monitoring (FreeStyleLibreTM, Abbott Diabetes Care). HbA1c values were determined with DCA Vantage (Malvern, US) immediately after 4-week glucose monitoring. This cohort includes all consecutive patients on the FreeStyleLibreTM system in the clinic during a period of 9 months from December 2015 to August 2016. Since this cohort has stable individual monthly glucose profiles, the 4-week download time was chosen to standardize the procedure. In our analysis, 2-week and 4-week glucose averages do not make much difference. For this non-interventional, real life observational study, each participant gave an oral informed consent by European directives that require no approval from an ethics committee for this kind of clinical research.
For these 92 subjects, simple linear regression between eA1c and HbA1c shows R2 = 0.63 and a slope of 0.615 with 95% confidence interval of ±0.049, which is significantly different from the theoretical slope of 1. Upon inspection, we found that subjects with relatively younger age and shorter diabetes history tend to have a better agreement between eA1c and HbA1c. We then grouped the subjects into two (half) and three (tertile) similar size subgroups by diabetes duration and age, respectively. Linear regression fittings of eA1c and HbA1c within these subgroups are shown in table 1. Linear regression fittings of eA1c and HbA1c in these subgroups give distinct slopes and R2 values. The subgroup with the shortest diabetes duration and youngest age has the highest R2 of 0.784 (p-value<0.0001) and slopes that are closest to 1. The slopes and R2 values decrease as the diabetes duration and age increases. Within regression lines, the differences between 1st and 2nd half diabetes duration subgroups, 1st and 3rd tertile diabetes duration subgroups, as well as 1st and 3rd tertile age subgroups are large and statistically significant. The 2nd and 3rd tertile subgroups on both age and diabetes duration shows no statistical significance but the differences in slope, intercept and R2 values are large. These differences are likely to be statistically significant with a larger sample size. The regression lines for the two diabetes duration bins above and below 19 years are shown in figure 1.
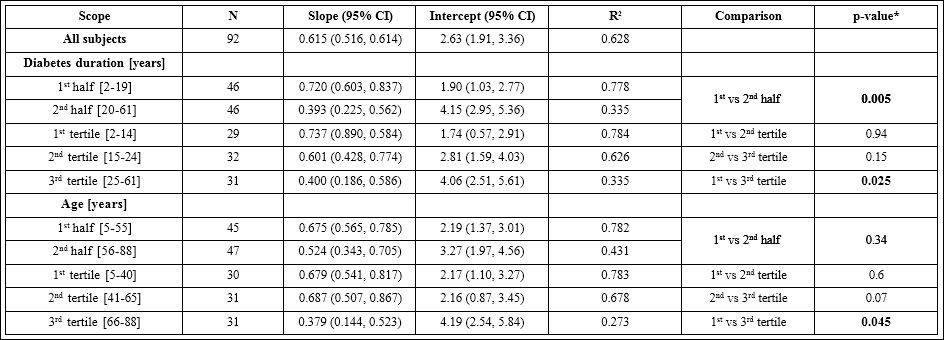
Table 1: Comparison of Linear Regression Lines between Estimated A1c and HbA1c for Subgroups.
The slopes, intercepts, as well as their 95% confidence intervals and R2 values, are calculated from linear regression analyses between estimated A1c ( eA1c(%) = (AG(average sensor glucose mg/dL) +46.7)÷ 28.7) and lab HbA1c in even age and diabetes duration subgroups of 92 subjects. *p-values were calculated with Chow test to compare the intercept and slope simultaneously.
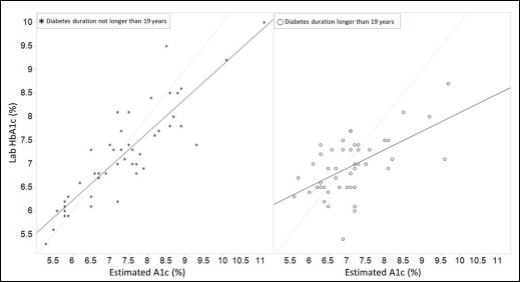
Figure 1: Correlation between laboratory HbA1c and estimated A1c. The identity line is shown in light gray line.
We noticed that the subgroup regression lines intercept with the identity line between 6.5-7% in eA1c. It appears that, at least in this cohort, eA1c values tend to overestimate HbA1c above approximately 7.5% eA1c and underestimate HbA1c below 6% eA1c. And the minimum systemic deviation between HbA1c and eA1c can be expected around 6-7.5% in eA1c or 126-169 mg/dL in average glucose. It appears that the glycation of red blood cell is faster in the shorter diabetes duration subgroup and slower in the longer diabetes duration subgroup, which may reflect the body self-adapting adjustment to the glucose level. The slope difference among diabetes duration groups suggests different red blood cell glycation response due to disease progression. Therefore, diagnostic indices based on HbA1c may need to be adjustedfor disease duration.
In conclusion, older age and longer diabetes history appear to be associated with weaker correlation (measured by R2) between Average sensor glucose (eA1c) and HbA1c, as well as decreasing slope and larger deviation from the theoretical slope. Since the subjects have similar ethnicity, this trend cannot be attributed to ethnic differences. It may be speculated that physiological changes due to diabetes disease progression and age, such as changes in glycation rate, red blood cell elimination and generation rates [5,6], or other factors, could result in the observed changing relationship. The underlying mechanism and limitations of this observation require further investigation, for example, the possible presence of anemia or other Comorbidities which may influence the A1c lab result, and allow better differentiation of the factors of diabetes duration and age. The frequent and systematic discrepancies of HbA1c and average glucose on individual level suggest that glucose level or Ambulatory Glucose Profile (AGP) may be more individually relevant for glucose control, with HbA1c used as a reference to guide individual targets for glucose control. Given the report on racial differences in HbA1c in the setting of similar average glucose level, disease progression and physical conditions are likely playing a role in hemoglobin glycation in response to glucose concentration [7]. At an individual level, the HbA1c-to-eA1c relationship may provide insight to disease progression. Besides age and diabetes duration, time in range, time in hypoglycemic and hyperglycemic are also interesting metrics for future study.
Acknowledgment
None
References
- Nathan DM, Kuenen J, Borg R, Zheng H, Schoenfeld D, et (2008) Translating the A1C assay into estimated average glucose values. Diabetes Care 31: 1473-1478.
- Sacks DB, Bebu I, Lachin JM (2017) Refining Measurement of Hemoglobin Clin Chem.
- Sacks DB (2007) Correlation between Hemoglobin A1c (HbA1c) and Average Blood Glucose: Can HbA1c Be Reported as Estimated Blood Glucose Concentration? J Diabetes Sci Technol 1: 801-803.
- Beck RW, Connor CG, Mullen DM, Wesley DM, Bergenstal RM (2017) The Fallacy of Average: How Using HbA1c Alone to Assess Glycemic Control Can Be Misleading. Diabetes Care 40: 994-999.
- Cohen RM, Franco RS, Khera PK, Smith EP, Lindsell CJ, et al. (2008) Red cell life span heterogeneity in hematologically normal people is sufficient to alter HbA1c. Blood 112: 4284-4291.
- Beltran Del Rio M, Tiwari M, Amodu LI, Cagliani J, Rodriguez Rilo HL (2016) Glycated Hemoglobin, Plasma Glucose, and Erythrocyte Aging. J Diabetes Sci Technol 10: 1303-1307.
- Ziemer DC, Kolm P, Weintraub WS, Vaccarino V, Rhee MK, et al. (2010) Glucose-independent, black-white differences in hemoglobin A1c levels: a cross-sectional analysis of 2 studies. Annals of Internal Medicine 152: 770- 777.
Citation: Xu Y, Antuña DR, Dunn T (2017) Diabetes Duration and Age May Affect the Relationship between HbA1c and Estimated A1c Derived from Average Sensor Glucose. J Diab Meta Syndro 1: 004.
Copyright: © 2017 Xu Y, et al. This is an open-access article distributed under the terms of the Creative Commons Attribution License, which permits unrestricted use, distribution, and reproduction in any medium, provided the original author and source are credited.